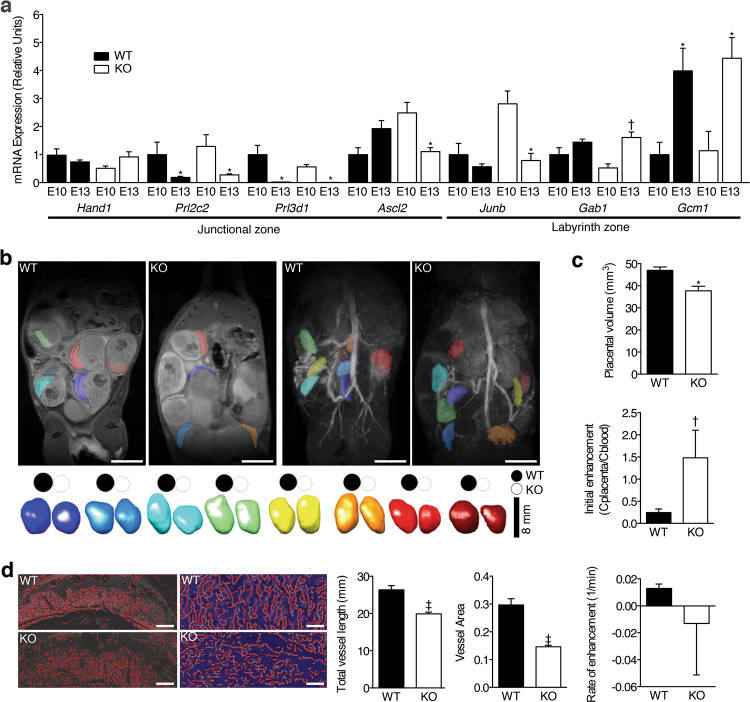
Fig. 2. Gal-3 deficiency results in placenta insufficiency.
a Relative mRNA expression of trophoblast differentiation genes determined by quantitative PCR (qPCR) on E10 and E13 placentas (n = 6–8). b 2D pre-contrast anatomical overview of MR images through abdomen of representative Lgals3+/+ (WT) and Lgals3−/− (KO) dams. Placentae labeled with false color transparent overlay (top left panel). 3D post-contrast maximum intensity projection angiograms of the mouse abdomen to determine placental volumes based on contrast enhancement (top right panel). 3D reconstruction of individual placentas ordered by volume (largest to smallest from left to right) are shown pair wise for Lgals3+/+ (WT) and Lgals3−/− (KO) animals. For better visual comparison, placental volumes were projected onto discs shown above each reconstruction illustrating smaller placentas in the Lgals3−/− animals (bottom panel, bar = 8 mm). c Group comparison of placental volumes over all animals confirmed a decrease in Lgals3−/− animals (top panel). Series of post-contrast images were acquired and mean signal was quantified repetitively for each placenta over ~10 min for functional MRI phenotyping. Initial enhancement, representative of maternal fractional blood volume in percent was increased in Lgals3−/− placentae whereas the rate of enhancement representative of several functional parameters such as perfusion, contrast agent inflow, clearance, and uptake was unchanged. Notably, a higher variability was found in KO animals for both, initial (middle panel) and rate (bottom panel) of enhancement (n = 8–16). d Isolectin B4 (IB4) staining showed poor development of fetal capillaries in the labyrinth of placentae of Lgals3−/− KO mice as revealed by AngioTool analysis (Total vessel length and vessel area; left bar = 500 μm and right = 150 μm, n = 25–34). In all figures, data are expressed as mean ± SEM. *P < 0.05, †P < 0.01, and ‡P < 0.001 using two-tailed t test.

