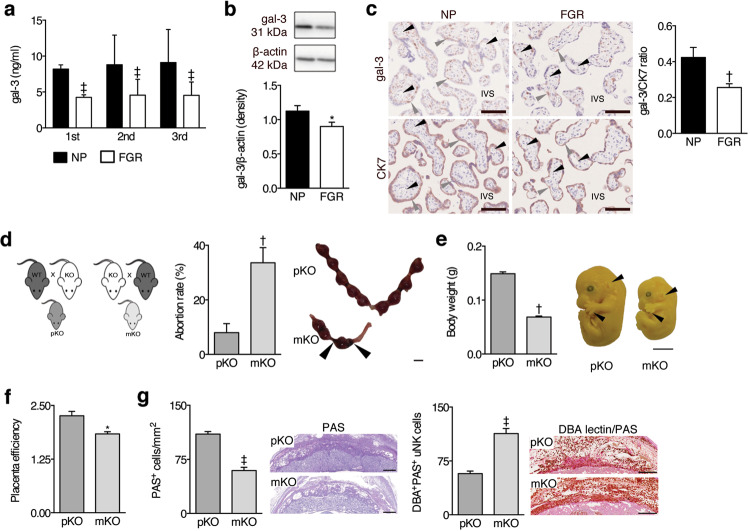
Fig. 3. Maternal gal-3 is necessary for normal placental and fetal development.
a Circulating maternal gal-3 evaluated by ELISA in PRINCE cohort of patients (n = 65) during first, second, and third trimester, where some women subsequently development FGR (n = 32). b Western blot analysis of gal-3 expression in placental tissue from normal, healthy human pregnancies (NP) (n = 27) and pregnancies complicated by FGR (n = 19). Densitometry was performed to quantify changes in protein expression using ImageJ. c Representative images of gal-3 and cytokeratin (CK) 7 immunohistochemistry in NP and FGR placentae (n = 14, bar = 100 μm; left panel). The percent staining area of gal-3 and CK7 slides was quantified, and a ratio was calculated by dividing the percent area of gal-3 to CK7 staining in slides from the same placental tissue sample (right panel). d Schematic diagram showing the lack of paternal (mating of Lgals3−/− (KO) male with Lgals3+/+ (WT) female, pKO) and maternal (mating of Lgals3+/+ (WT) male with Lgals3−/− (KO) female, mKO) gal-3. The offspring is heterogeneous (HT) for gal-3 in both mating combinations (left panel). The abortion rate was calculated on E13 as follows: abortion rate = (fetal resorptions x 100)/total number of implantations (middle panel, n = 6–8). Pictures display whole implantation sites on E13. Arrows point to fetal resorptions (right panel, bar = 1 cm). e The embryo body weight was determined on E13 to identify potential fetal growth restriction (FGR) (n = 6). To assess the fetal development, Theiler stage (TS) analysis was performed. Normally developed embryos on E13 are in TS22 (pKO). FGR embryos are in a lower stage (e.g., TS21 or 21.5) and are characterized by a pinna that is not turned forward and non-separated fingers (arrows; mKO) (bar = 0.25 cm). f Placental efficiency was calculated as fetal/placental weight ratio on E13 (n = 14–21). g Glycogen cells in the spongiotrophoblast of the placenta were stained with periodic acid Schiff (PAS) and counted in 3 squares (1 × 1 mm) per mouse on E13 (n = 14–21). The number of mature uterine natural killer (uNK) cells in the decidua basalis were counted in 3 to 4 squares (1 × 1 mm) per mouse (n = 19–26). In all figures, data are expressed as mean ± SEM. *P < 0.05, †P < 0.01, and ‡P < 0.001 using two-tailed t test.

