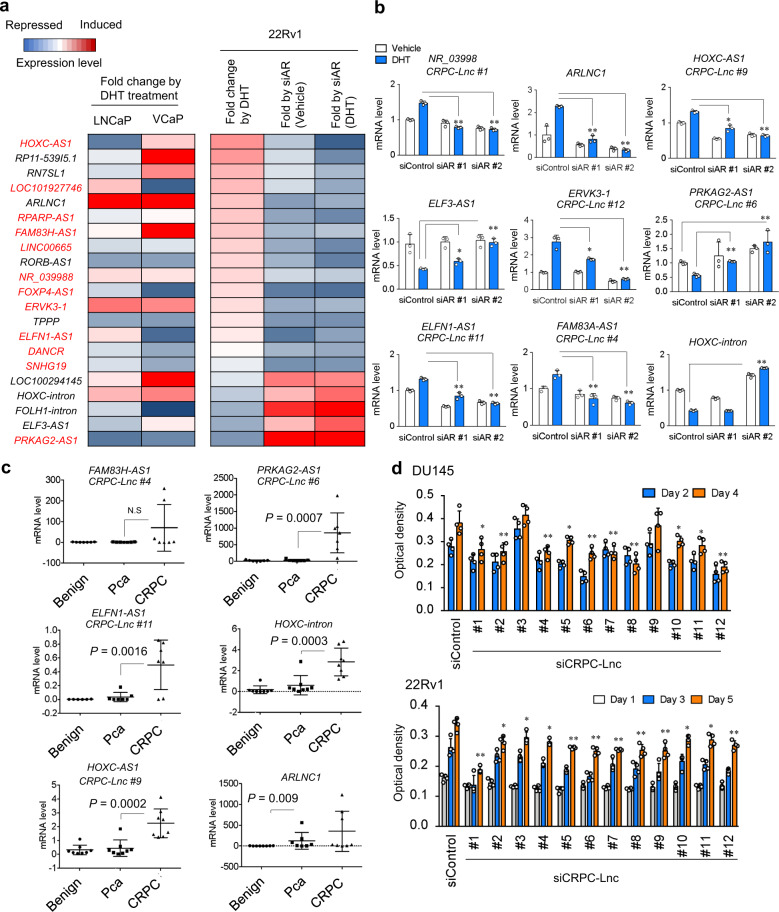
Fig. 4. Regulation of AR-regulated lncRNAs and their roles in CRPC cell growth.
a qRT-PCR validation of AR regulation in AR-positive prostate cancer cells. LNCaP and VCaP cells were treated with 10 nM DHT or vehicle for 24 h. 22Rv1 cells were treated with siControl or siAR (10 nM siAR #2). After 48 h incubation, cells were treated with 10 nM DHT or vehicle for 24 h. Expression levels were determined by qRT-PCR analysis. Average of technical triplicate results is summarized as heatmap. Fold changes by DHT treatment compared with vehicle were shown. Fold change by siAR treatment compared with siControl in the presence or absence of DHT were also shown in the result of 22Rv1 cells. CRPC-Lncs for functional analysis (Table 1) are marked by red letters. b qRT-PCR validation of AR regulation in 22Rv1 cells using two types of siAR. Cells were treated with siControl or siAR #1 and #2 (10 nM) for 48 h. siAR#1 targets only AR full length. siAR#2 targets both full length and variants of AR15. Then cells were treated with 10 nM or vehicle for 24 h. Expression level of CRPC-Lncs and HOXC-intron were determined by qRT-PCR analysis (N = 3). Values represent mean ± S.D. *P < 0.05, **P < 0.01. vs siControl sample treated with DHT. c Validation of CRPC-Lncs expression levels in tumor samples by qRT-PCR analysis. Total RNA was extracted from clinically independent samples of benign (N = 8), prostate cancer (N = 8), and CRPC (N = 7 or 8). Expression level of each lncRNA was measured by qRT-PCR. P value was determined by Mann–Whitney U test. Values represent mean ± S.D. d Cell proliferation of CRPC model prostate cancer cells was attenuated by knockdown of CRPC-Lncs. DU145 and 22Rv1 cells were treated with siControl or siCRPC-Lncs (10 nM). Cell proliferation was determined by MTS assay (N = 5). Values represent mean ± S.D. *P < 0.05, **P < 0.01 vs siControl.

