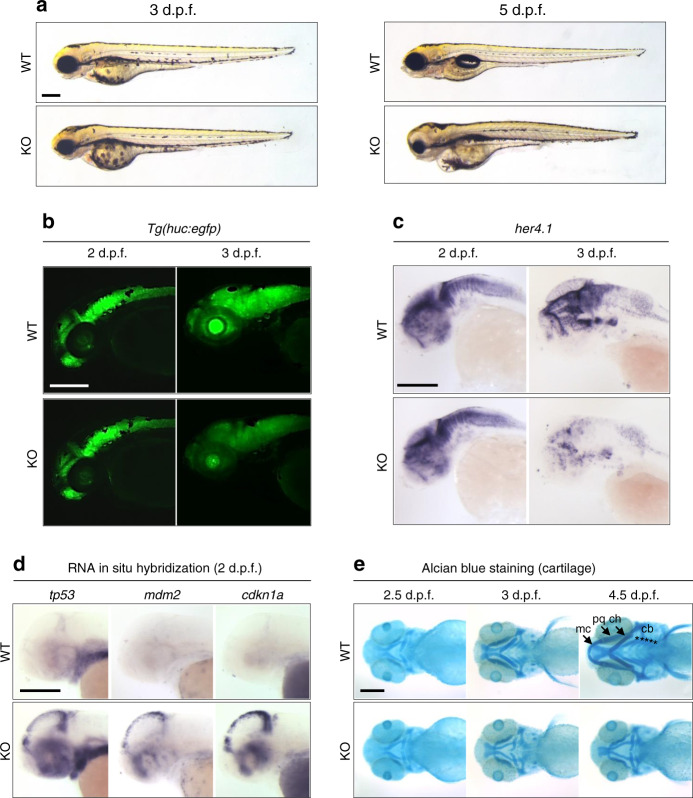
Fig. 2. fam50a KO zebrafish display central nervous system and craniofacial patterning defects.
a Representative bright field lateral images of WT and fam50a KO are shown at 3 and 5 days post-fertilization (dpf). Morphology of fam50a KO was relatively normal at 3 dpf; repeated four times. However, at 5 dpf, fam50a KO showed craniofacial abnormalities; repeated five times. Number of larvae assessed with similar results: 3 dpf, n = 56; 5 dpf, n = 44. b Fluorescent lateral images of WT and fam50a KO larvae on a Tg(huc:egfp) neuronal reporter. No difference between WT and fam50a KO was detected in the anterior structures at 2 dpf. However, at 3 dpf, a prominent reduction of GFP-positive neurons was observed in KO larvae. Number of larvae assessed with similar results: 2 dpf, n = 20; 3 dpf, n = 20. c Whole-mount in situ hybridization (WISH) of her4.1, a molecular marker of neurogenesis, indicated a depletion of neurons in fam50a KO compared to WT at 3 dpf; repeated. Number of larvae assessed with similar results: 2 dpf, n = 24; 3 dpf, n = 21. d Apoptosis markers are elevated in fam50a KO larvae at 2 dpf. Note the induction of tp53 and tp53 target genes, mdm2 and cdkn1a (p21) in the cell proliferative zone in the midbrain region fam50a KO larvae at 2 dpf; repeated. Number of larvae assessed with similar results: tp53, n = 41; mdm2, n = 52; cdkn1a, n = 39. e Representative ventral images of Alcian blue staining of cartilage structures shows severe defects in cartilage development that become apparent at 3 dpf. Meckel’s cartilage, mc; palatoquadrate, pq; ceratohyal arch, ch; and ceratobranchial arches, cb. Number of larvae assessed with similar results: 2.5 dpf, n = 28; 3 dpf, n = 21; 4.5 dpf, n = 14. For all images: anterior, left; posterior, right. Scale bars; 200 μm.

