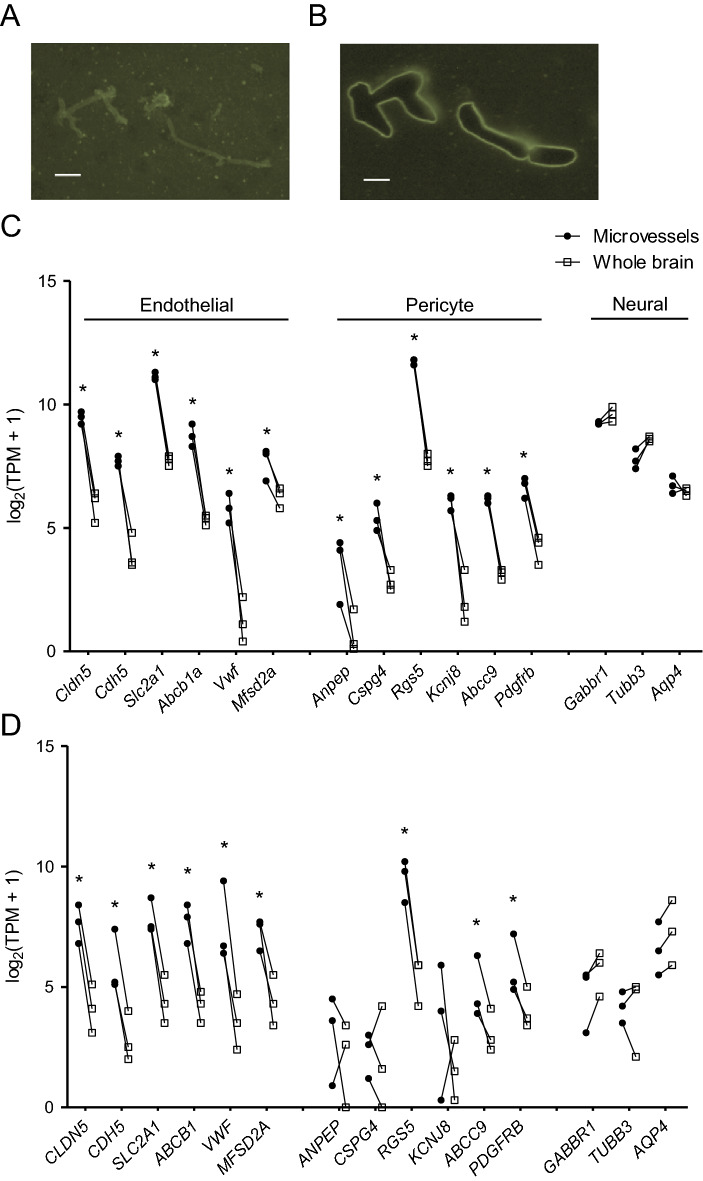
Figure 1.
LCM of brain microvessels yields transcriptomic datasets enriched in endothelial and pericyte markers. (A,B) Representative lectin-stained mouse brain sections before (A) and after (B) LCM. Scale bars: 50 μm. (C,D) Transcript abundance [log2(TPM + 1)] of endothelial, pericyte, and neural genes in mouse (C) and human (D) whole brain and LCM microvessel samples. Lines connect datapoints from matched LCM microvessel and whole brain samples. *P < 0.05 versus whole brain, DESeq2 Wald test with Benjamini–Hochberg correction. Exact P-values are provided in Supplementary Table S4.

