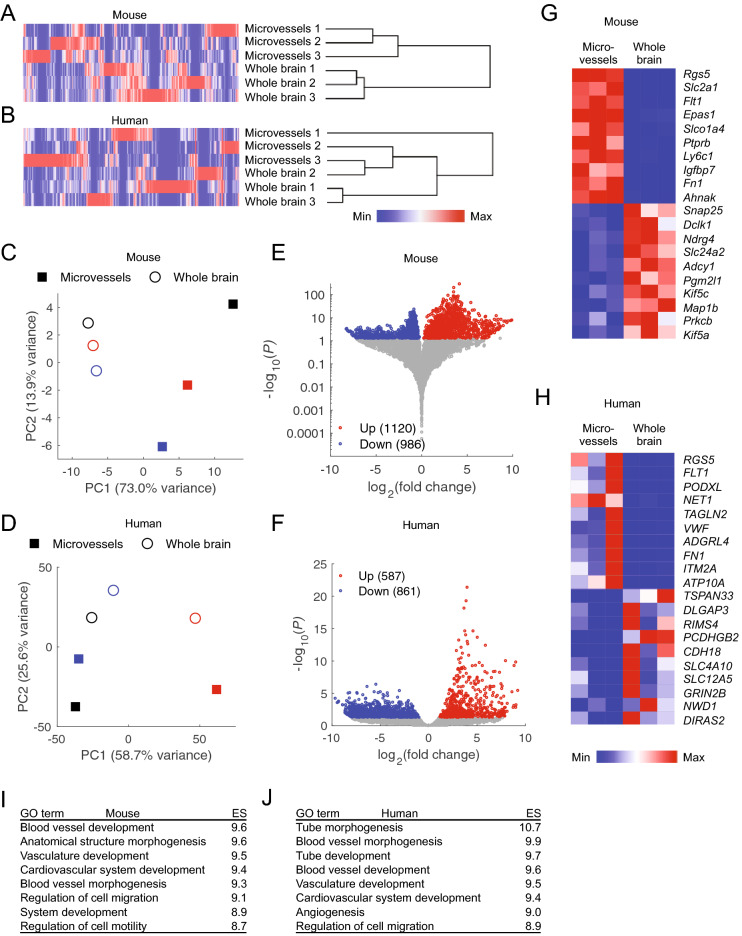
Figure 3.
Differentially expressed genes in mouse and human LCM microvessels compared to whole brain. (A,B) Whole-transcriptome hierarchical clustering of mouse (A) and human (B) LCM microvessels and whole brain datasets. Color indicates expression that has been normalized within each gene (column). (C,D) Principal component analysis of mouse (C) and human (D) LCM microvessels and whole brain datasets. Data are plotted in the space of the first two principal components, with the percentage of variance explained by principal component 1 (PC1) and principal component 2 (PC2) shown in axis labels. Microvessel and whole brain datapoints of the same color are derived from matched samples. (E,F) Volcano plots illustrating genes differentially expressed between LCM microvessels and whole brain samples from mouse (E) and human (F). The number of LCM microvessel-enriched (Up) and depleted (Down) genes with adjusted P-values < 0.05 (from DESeq2) are shown in the legends. Full results of differential expression analysis are in Supplementary Table S4. (G,H) Heat maps illustrating transcript abundance in biological triplicates of LCM microvessels and whole brain for the 10 highest confidence LCM microvessel-enriched and the 10 highest confidence microvessel-depleted genes in mouse (G) and human (H). Color indicates expression that has been normalized within each gene (row). (I,J) Gene ontology (GO) terms for biological processes enriched in LCM microvessels compared to whole brain from mouse (I) and human (J). ES: enrichment score [− log10(P)].

