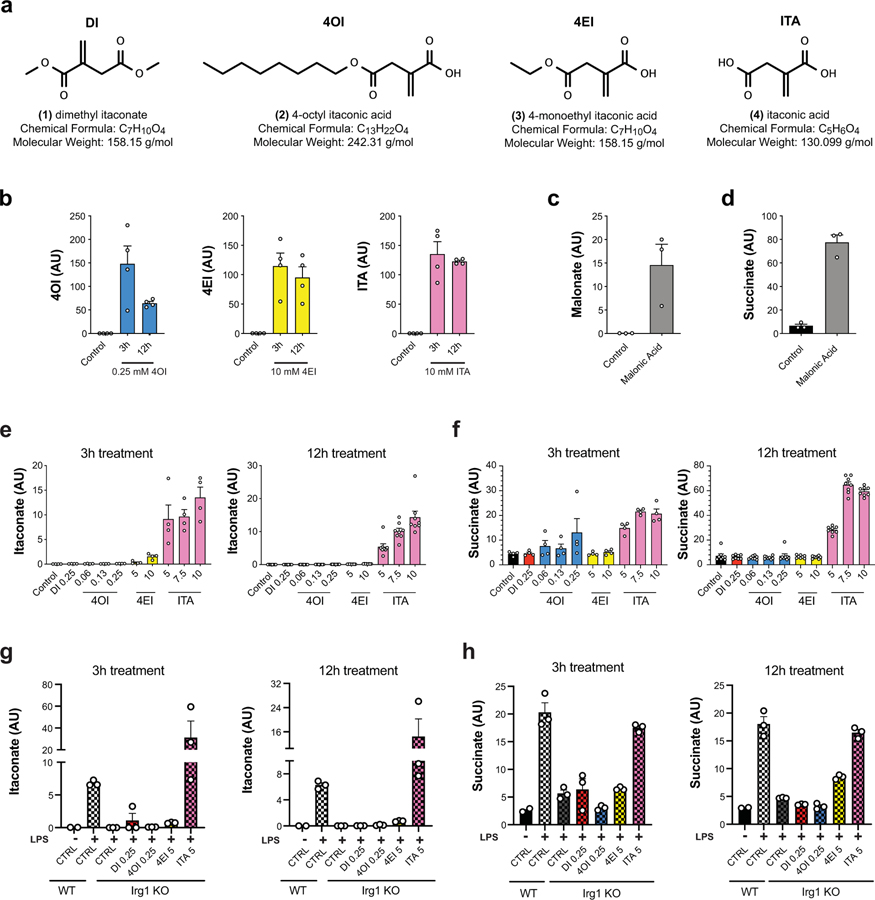
Figure 1: Unmodified itaconate accumulates in macrophages and promotes succinate accumulation.
a, Chemical structures of itaconate and its derivatives. b, Intracellular levels (n = 4 cultures) of 4OI (blue), 4EI (yellow), and itaconate (pink) after 3h or 12h treatment with the indicated compound in WT BMDMs. Intracellular detection of DI is not amenable to the electrospray ionization LCMS method used for these experiments. c, d, Intracellular levels (n = 3 cultures) of malonate (c) and succinate (d) in WT BMDMs after 3h treatment with 5 mM malonic acid. e, Intracellular levels of itaconate after 3h (n = 4 cultures) or 12h (n = 8 cultures) treatment with the indicated compounds in WT BMDMs. f, Intracellular levels of itaconate after 3h or 12h treatment (n = 3 cultures, except for WT CTRL n = 2 cultures) with the indicated compounds followed by 24h static incubation (unstimulated) or 24h LPS stimulation in WT or Irg1−/− BMDMs. g, Intracellular levels of succinate after 3h (n = 4 cultures) or 12h (n = 8 cultures) treatment with the indicated compounds in WT BMDMs. h, Intracellular levels of succinate after 3h or 12h treatment (n = 3 cultures, except for WT CTRL n = 2 cultures) with the indicated compounds followed by 24h static incubation (unstimulated) or 24h LPS stimulation in WT or Irg1−/− BMDMs. Treatment concentrations for all experiments are listed in mM. All bar plots representative of mean ± s.e.m., except where n < 3 only the mean is depicted. AU = arbitrary units based on mass spectrometry peak area and is not directly comparable between experiments.

