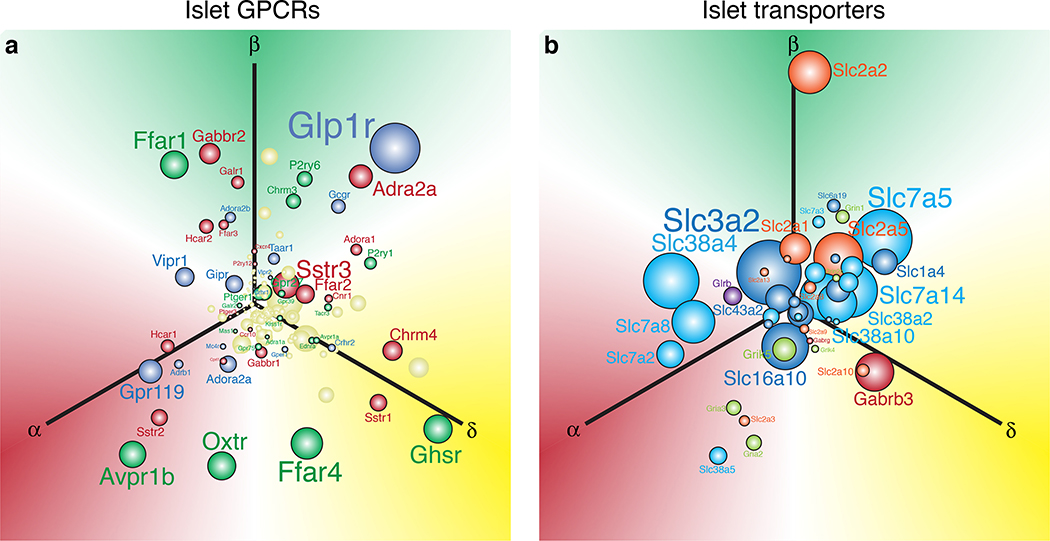
Figure 3. Visualisation of the abundance and selectivity of GPCR and transporter gene expression in alpha, beta, and delta cells.
We used the natural log of the normalised expression values for a gene (ln[RPKM]) to plot the relative position of that gene along three axes representing alpha, beta, and delta cells. These expression values are derived from transcriptomes of FACS-purified mouse alpha, beta, and delta cells described elsewhere33. a) Each of these three individual gene expression values are converted into x and y vectors and then consolidated into a single set of x, y coordinates that represents the overall selectivity of the expression of that gene. The origin represents equal expression (i.e. no enrichment) in each of the three islet cell types, whereas. placement in any direction along one of the axes reflects enrichment in the corresponding cell type. Sphere and font sizes are proportional to abundance of the gene based on the highest RPKM value for that gene in alpha, beta, or delta cells. b) The top 150 most abundant G protein-coupled receptors (GPCR) of the islet cells are color coded in accordance with the predominant signaling cascade associated with each receptor. Blue genes are Gαs-coupled, green are Gαq, red are Gαi, and yellow is ‘unknown’ or ambiguous based on receptor classifications from IUPHAR (International Union of Basic and Clinical Pharmacology)166. c) Non-GPCR receptors and transporters are colour-coded according to the class of signaling molecules utilised by each receptor/transporter, following IUPHAR classification for solute carriers.

