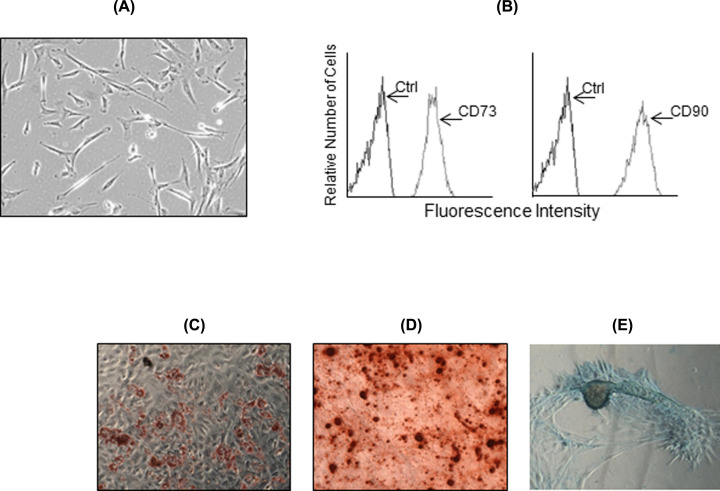
Figure 2. Phenotypical and functional characterization of MSC.
Microscopical observation shows the fibroblast-like morphology of MSC in culture (A). Flow cytometry analysis of MSC marker expression shows the expression of CD73 and CD90 (arrows). Negative controls were stained with the respective isotype (arrows) (B). Multipotent differentiation assays show the osteogenic (C), adipogenic (D) and chondrogenic (E) potential of MSC.

