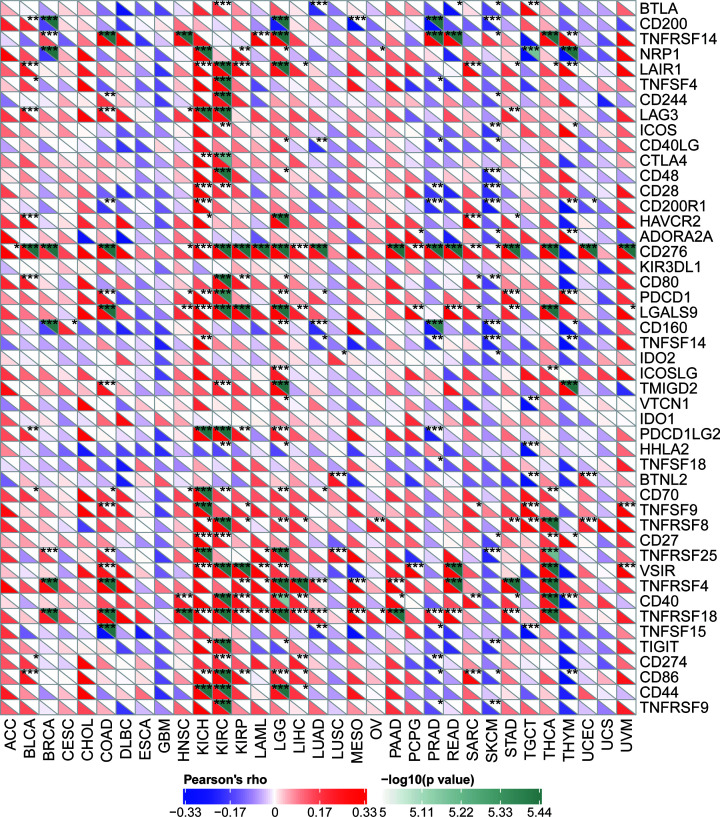
Figure 9. Correlation between YIF1B mRNA expression levels and acknowledged immune checkpoints’ mRNA expression in multiple tumors from TCGA database.
The lower triangle in each tile indicates coefficients calculated by Pearson’s correlation test, and the upper triangle indicates log10 transformed P-value. *P<0.05, **P<0.01, ***P<0.001.

