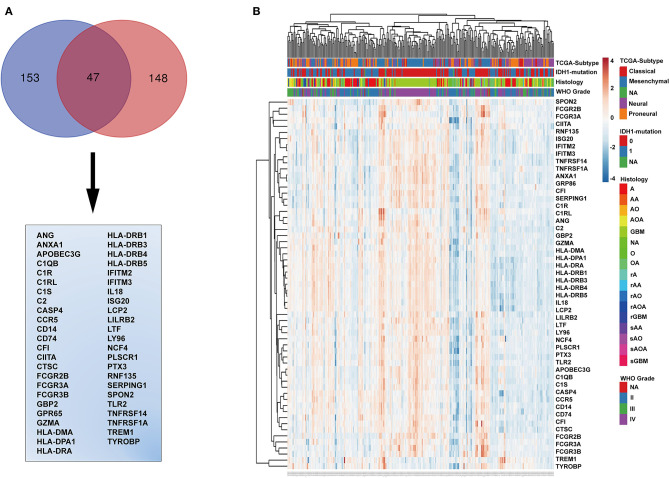
Figure 3.
Identification of immune-related genes. (A) Venn diagram displaying the intersection between the top 153 genes in the black module and the top 148 immune-related genes. The 47 genes at the intersection of these two groups are listed in the table below. (B) Cluster heatmap generated from expression profiles and clinical information of these 47 genes from the CGGA glioma database. IDH mutation, 0, wild type; 1, mutation; NA, unknown; A, astroglioma; AA, anaplastic astrocytoma; AO, anaplastic oligodendroglioma; AOA, anaplastic oligodendroastrocytoma; GBM, glioblastoma multiforme; O, oligodendroglioma; NA, unknown; rA, recurrent astroglioma; rAA, recurrent anaplastic astrocytoma; rAO, recurrent anaplastic oligodendroglioma; rAOA, recurrent anaplastic oligodendroastrocytoma; rGBM, recurrent glioblastoma multiforme; sAA, secondary anaplastic astrocytoma; sAO, secondary anaplastic oligodendroglioma; sAOA, secondary anaplastic oligodendroastrocytoma; sGBM, secondary glioblastoma multiforme.

