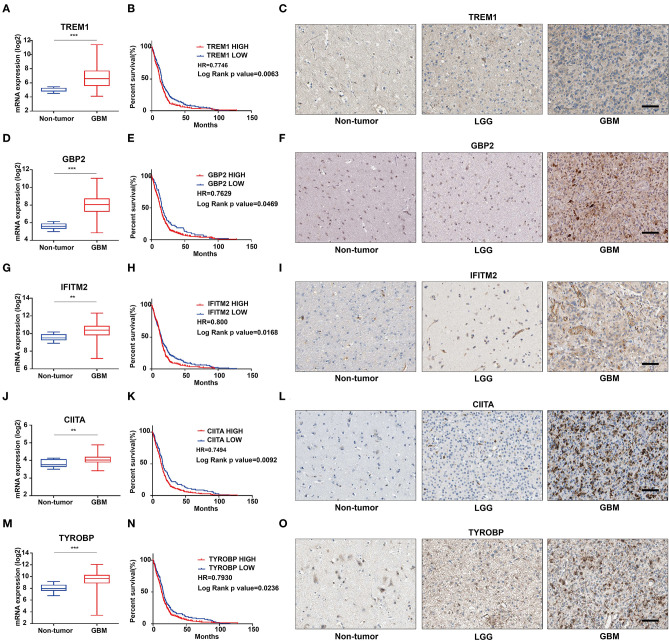
Figure 4.
The mRNA expression, survival analysis, and protein expression of TREM1, GBP2, IFITM2, CIITA, and TYROBP using the TCGA data. The three columns consist of images for mRNA levels of genes in non-neoplastic relative to GBM tissue samples, Kaplan-Meier survival curves for patients with genehigh vs. genelow tumor samples, and IHC for each gene in non-neoplastic, LGG, and GBM tissue samples from the TCGA database. (A) TREM1 mRNA levels in non-neoplastic relative to GBM tissue samples. (B) Kaplan–Meier survival curves for GBM patients with TREM1high and TREM1low tumors. (C) IHC of TREM1 in non-neoplastic tissues, LGG and GBM. (D–F) GBP2; (G–I) IFITM2; (J–L) CIITA; (M–O) TYROBP. **P < 0.01; ***P < 0.001 compared to non-tumor tissue (scale bar: 100 μm).

