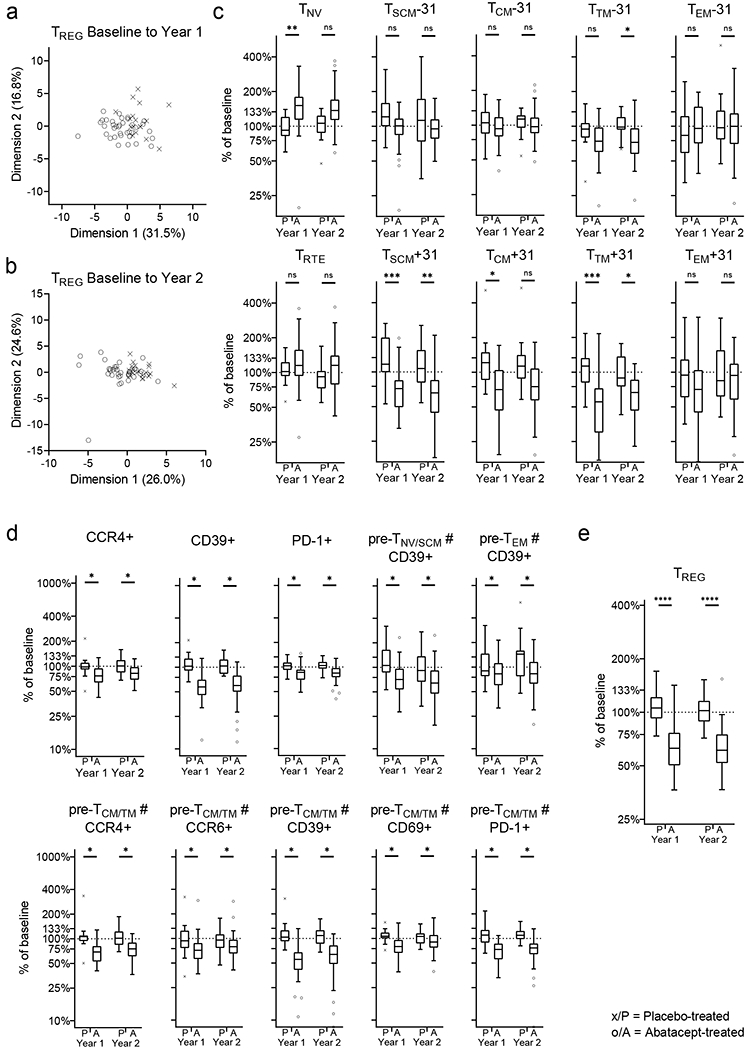
Figure 6: Change in TREG subsets in treatment groups.

Change in TREG subsets from baseline to year 1 and to year 2 in treatment groups is analysed (a, b and c). Principal component analysis of individuals from treatment groups are shown for baseline to year 1 (a) and to year to 2 (b). Change (as percentage from baseline) for TCONV subsets is shown (c). TCONV subsets (in depth phenotyping) with a significant abatacept treatment effect are shown (d). Abatacept treatment effect on total TREG (e) Mann-Whitney U-test with Benjamini-Hochberg correction; * p<0.05, ** p≤0.01, *** p≤0.001, **** p≤0.0001; The horizontal line in the middle of each box indicates the median; top and bottom borders mark the 75th and 25th percentiles, respectively; whiskers according to Tukey; See Material & Methods for definition of T-cell subsets. % of baseline; change in frequency of a specific T-cell subset, over time (i.e. from baseline to year 1 or year 2), represented as proportion of baseline frequency.
