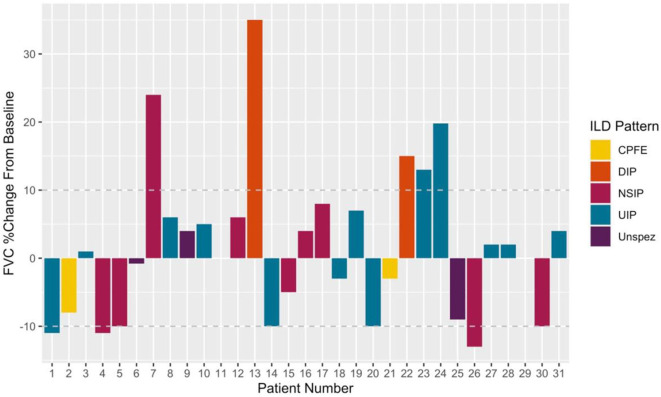
Figure 3.
Illustrating %changes in FVC following treatment initiation. Deltas calculated using last available measurement. Disease progression (treatment failure) was defined as a 10% fall in FVC from that recorded at treatment initiation. A 10% improvement symbolized Improved on treatment. Patients within ± 10% baseline were classed as stable.

