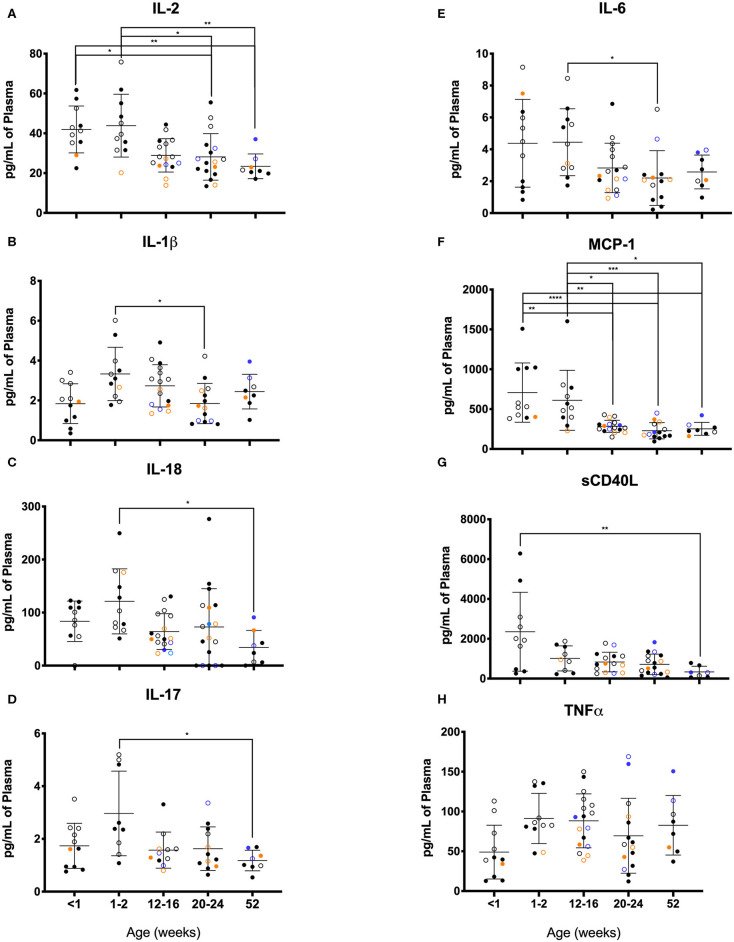
Figure 11.
Plasma cytokine concentrations were compared among age groups of pediatric rhesus macaques during the first year of life. Plotted data are shown for (A) IL-2, (B) IL-1β, (C) TNFα, (D) IL-17, (E) IL-6, (F) MCP-1, (G) sCD40L, and (H) IL-18. Results represent Research NR (black circles), Colony NR (blue circles), and Colony MR (orange circles) animals as well as those born outdoors (open circles) and indoors (filled circles). Results were plotted for each data point (mean ± st. dev. per age group). Statistical analyses were by based on results of age-binned samples in the Colony MR animals using the Kruskal-Wallis test coupled with Dunn's multiple comparisons test. *P < 0.05; **P < 0.01; ***P < 0.001; ****P < 0.0001.

