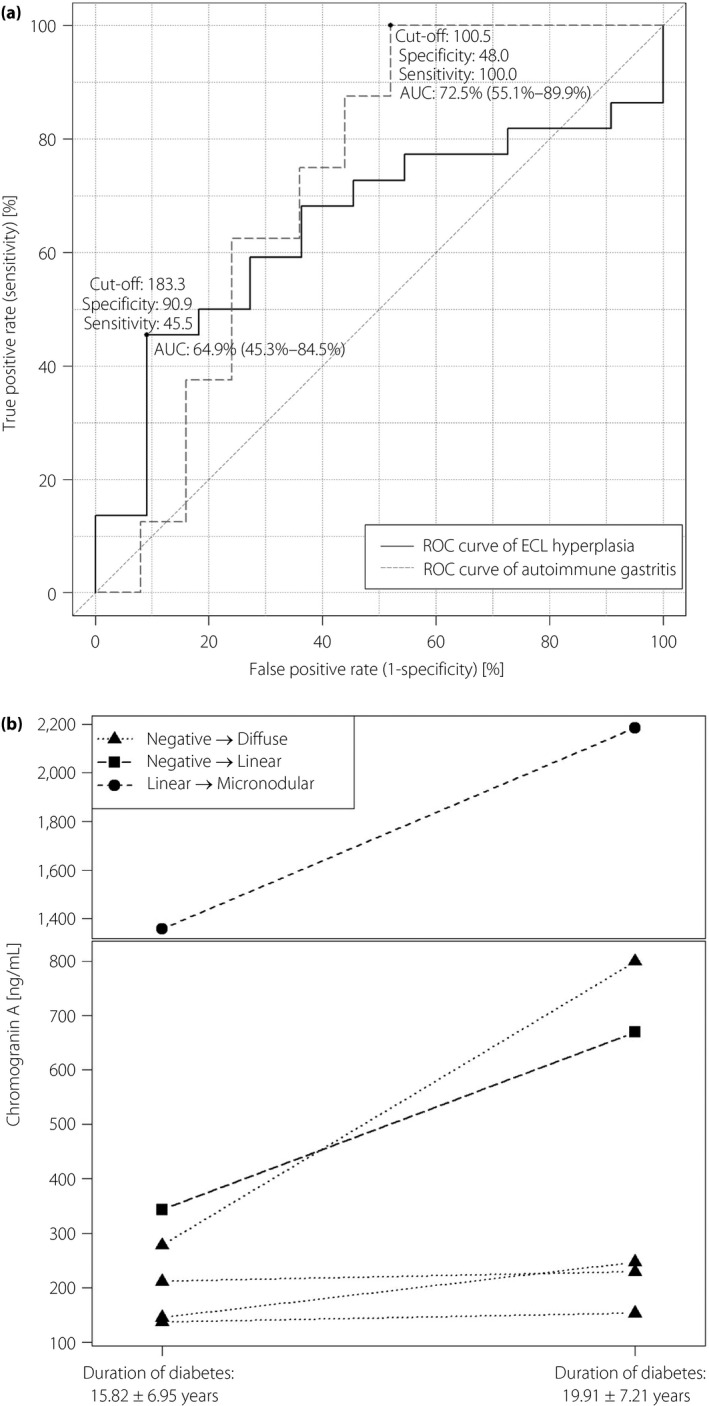
Figure 1.

(a) Receiver operating characteristic (ROC) curve of chromogranin A to detect enterochromaffin‐like neuroendocrine hyperplasia and autoimmune gastritis (n = 34). The two curves do not differ significantly (P = 0.5615). (b) Changes in serum chromogranin A levels of the patients who had progression in their neuroendocrine enterochromaffin‐like (ECL) hyperplasia types between the two gastroscopies (P = 0.0316). AUC, area under the curve.
