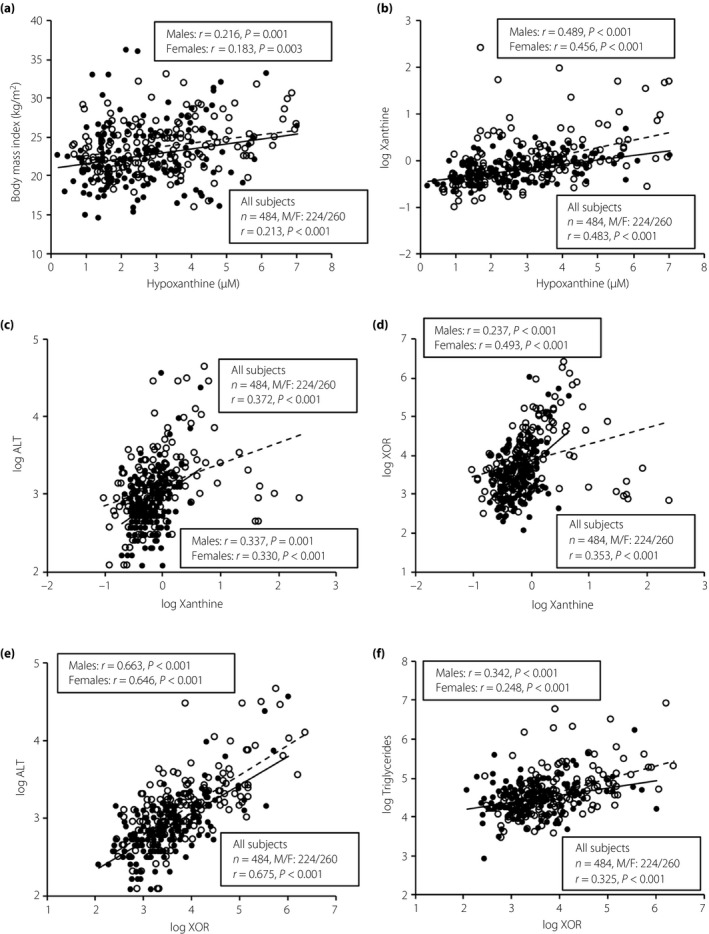
Figure 2.

Correlations of hypoxanthine, xanthine and plasma xanthine oxidoreductase (XOR) activity with metabolic parameters. (a) Body mass index and (b) logarithmically transformed (log) xanthine were plotted against the plasma level of hypoxanthine in each participant (n = 484). (c) Log alanine aminotransferase (ALT) and (d) log plasma XOR activity were plotted against log xanthine in each participant. (e) Log ALT and (f) log triglycerides were plotted against log XOR in each participant. Open circles and broken regression line, men (n = 224); closed circles and solid regression line, women (n = 260). M/F, male/female.
