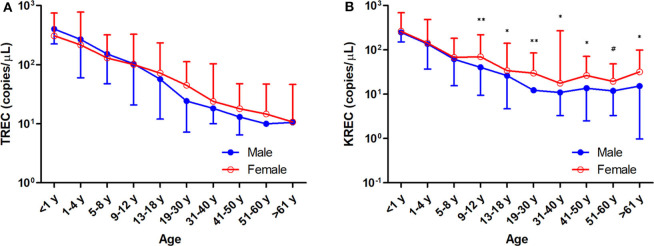
Figure 3.
Trend of TREC copies/μL blood (A) and KREC copies/μL blood (B) among the study age groups. Data is expressed as median ± range. Blue full circles represent healthy males and red empty circles represent healthy females. A significant higher KREC level was observed for age groups after 9–12 years, except for 51–60 years. *p < 0.05, **p < 0.01, #p = 0.0510.

