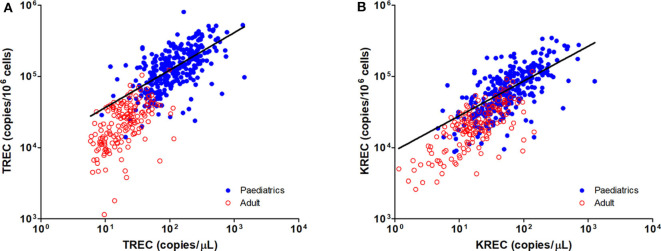
Figure 4.
Dot Plot showing the correlations between copies/μL blood and copies/106 cells for TREC (A) and KREC (B) levels. Blue full circles represent healthy pediatric individuals and red empty circles represent healthy adults. A significant positive correlation was observed between both units for TREC and KREC levels (TREC level: r = 0.8319, p < 0.0001; KREC level: r = 0.7794, p < 0.0001).

