Figure 1.

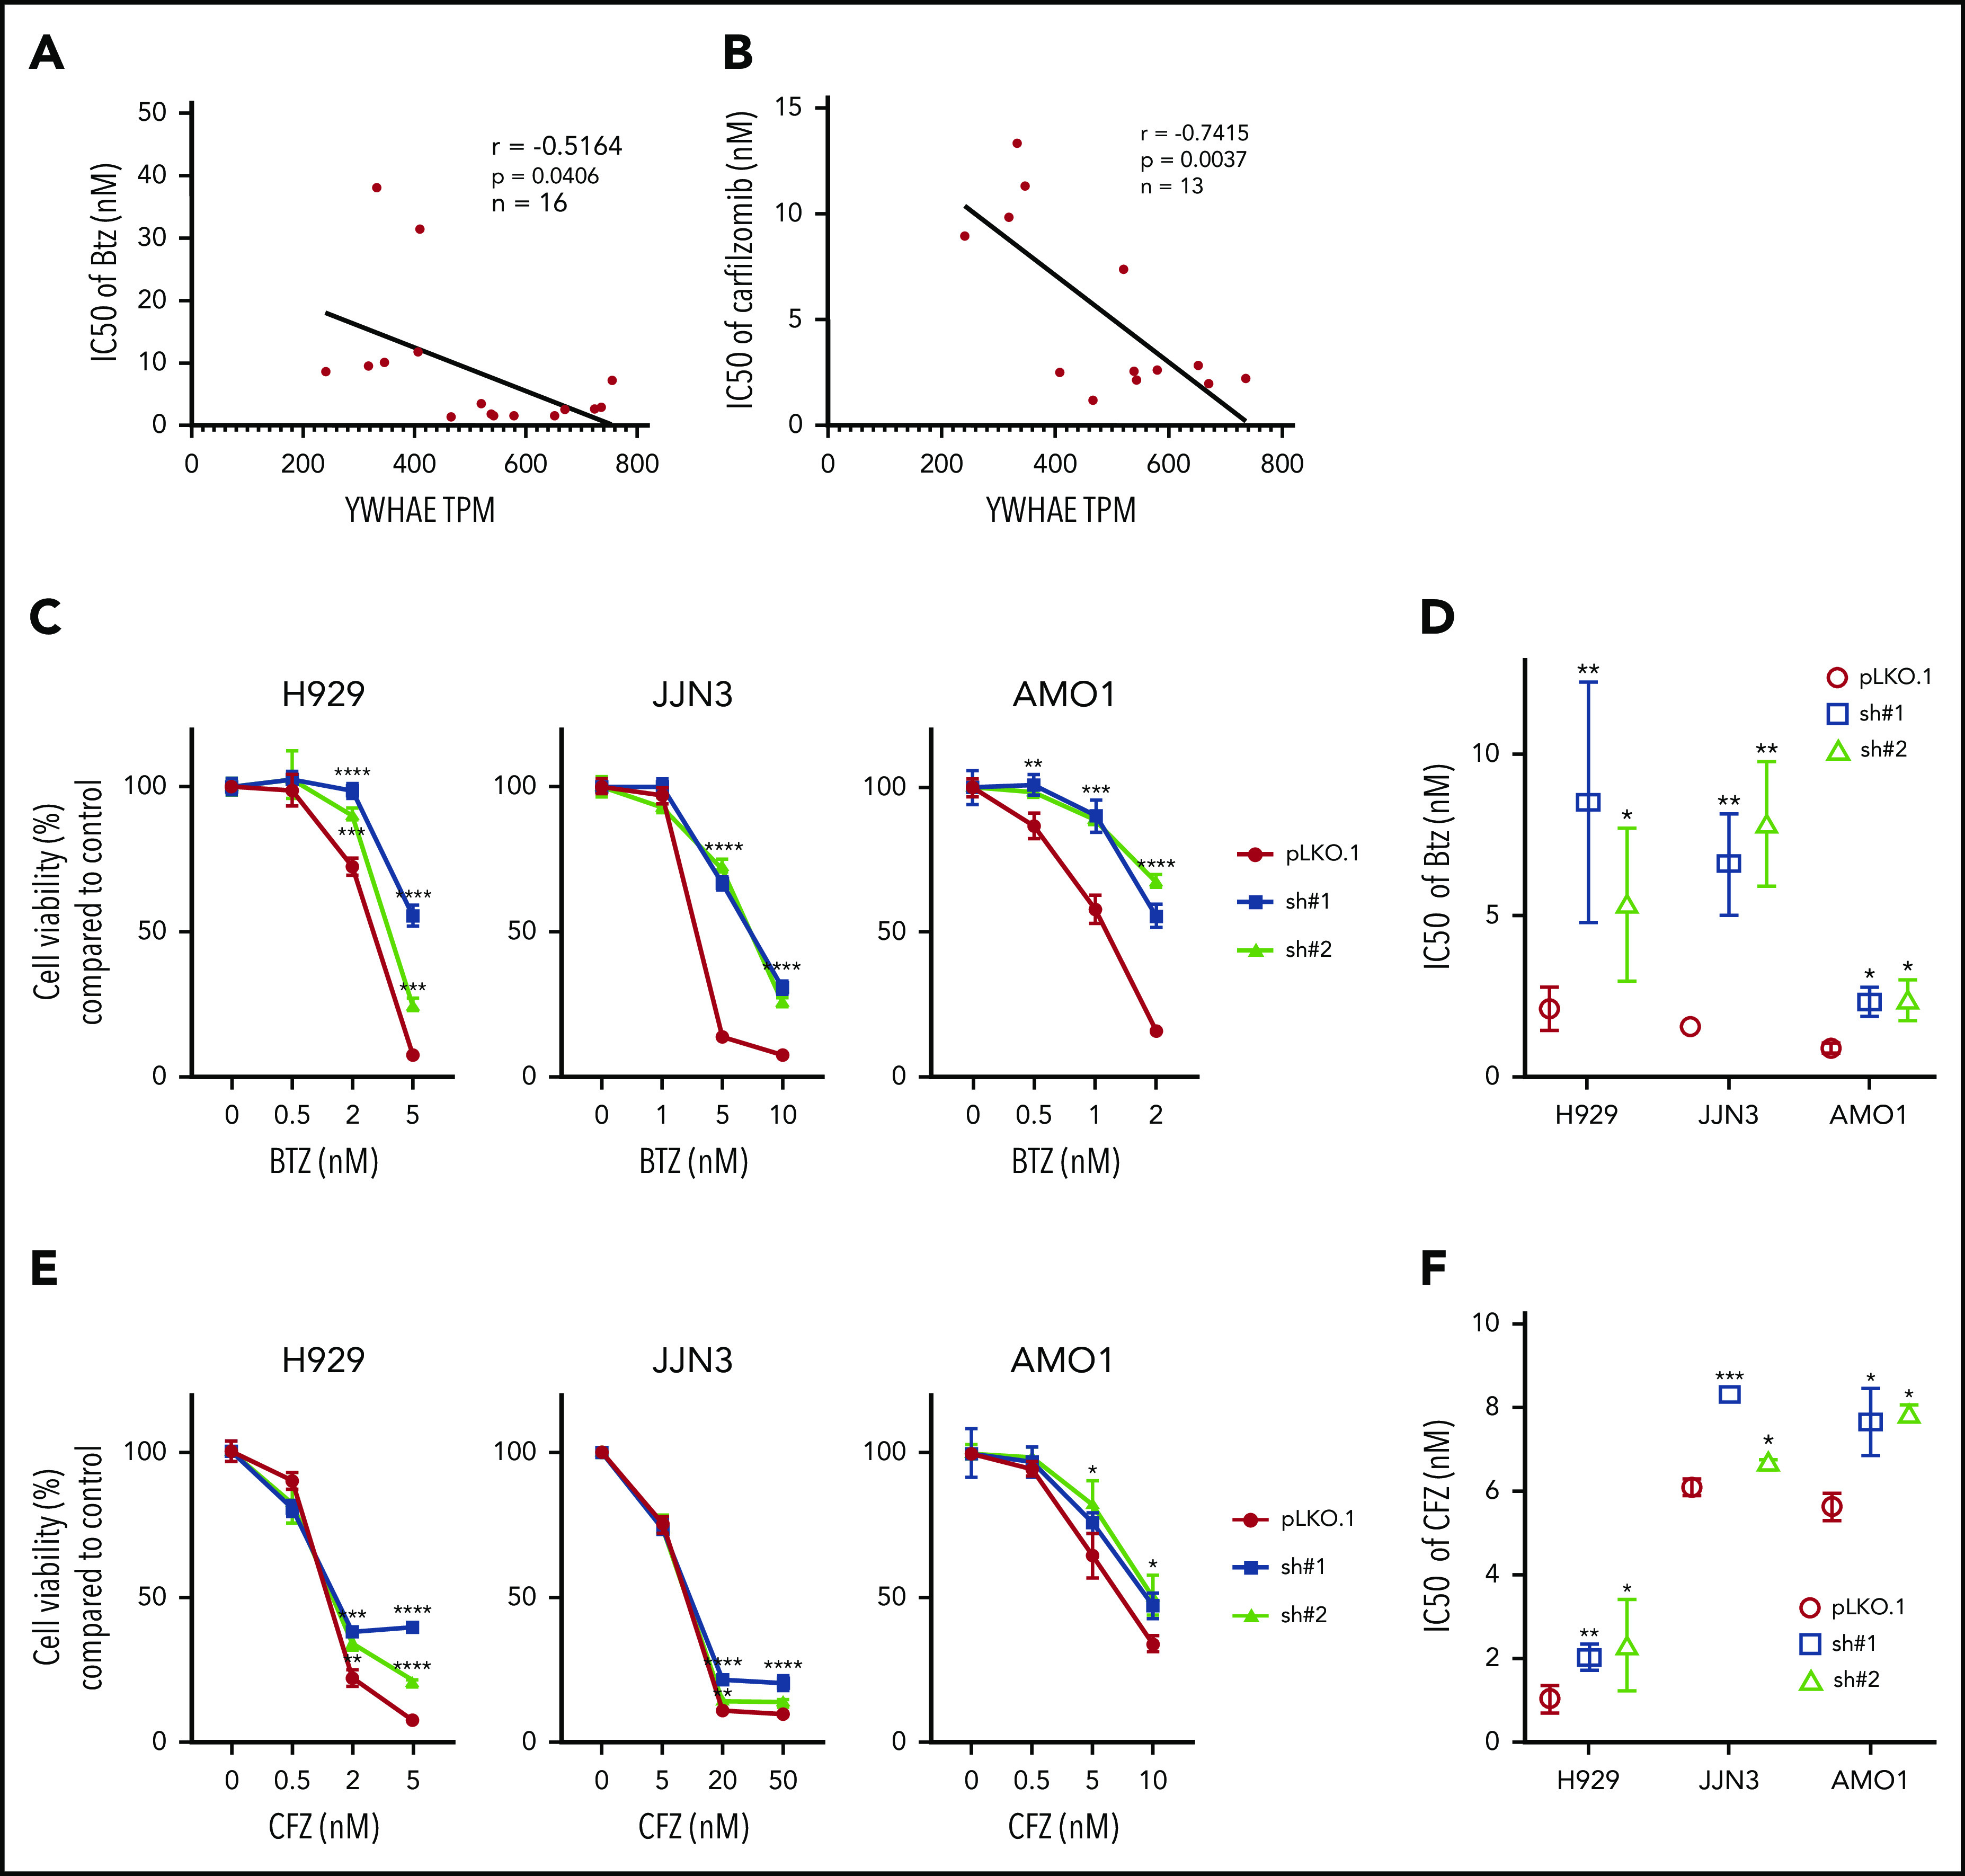
YWHAE/14-3-3ε expression levels correlates with PI sensitivity in MM cell lines. (A-B) A panel of MM cell lines were treated with different concentrations of BTZ (A) or CFZ (B) for 24 hours, and cell viability was evaluated by Cell-Titer Glo (CTG). IC50 was calculated with GraphPad Prism 8. Pearson correlation analysis of YWHAE mRNA expression level and IC50 for BTZ (A) or CFZ (B) is shown in the graph. (C-F) H929, JJN3, and AMO1 MM cells were infected with either scrambled (pLKO.1) or 14-3-3ε-targeted shRNA and selected with puromycin for 72 hours. Transduced cells were treated with different concentrations of BTZ or CFZ for 24 hours. Cell viability was evaluated by CTG. (C,E) Results are expressed as percentage change compared with each untreated control cell. (D,F) IC50 analysis was performed using the GraphPad Prism 8 and shown in the right panels. Data represent mean ± SD from 3 experiments performed in triplicate. Data were analyzed using unpaired Student t tests: *P ≤ .05; **P ≤ .01; ***P ≤ .001; ****P ≤ .0001.
