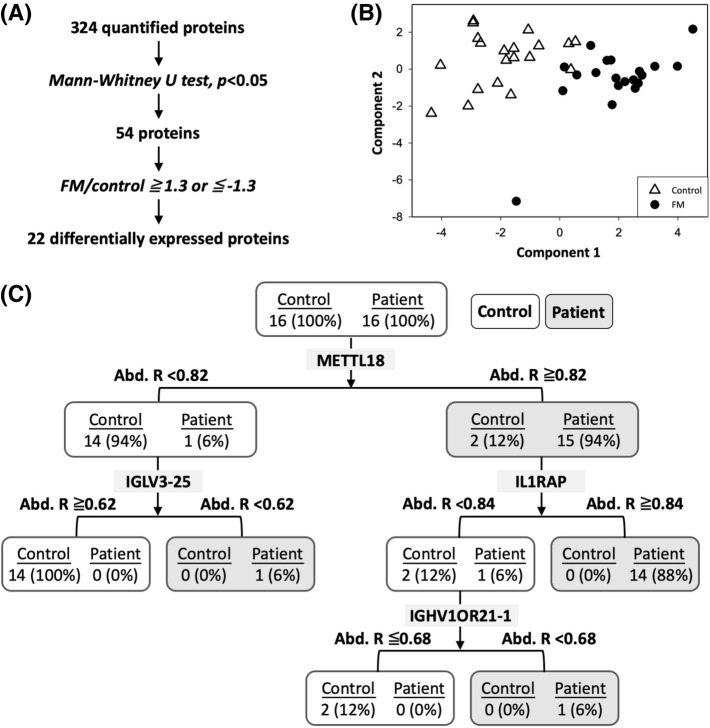
Figure 2.
(A) The analysis workflow for filtering significant candidate proteins. (B) The PLS-DA plot shows a clear grouping of patients with FM and controls by using the 22 candidate proteins. The PLS-DA transformation preserves as much covariance as possible between the 22 candidate proteins and sample labels in the first component, which is the most relevant for distinguishing sample labels. The first two components are retained to distinguish the control and FM samples. (C) The decision tree analysis of candidate proteins suggests a panel of four proteins for accurate identification of patients with FM.

