Figure 4.
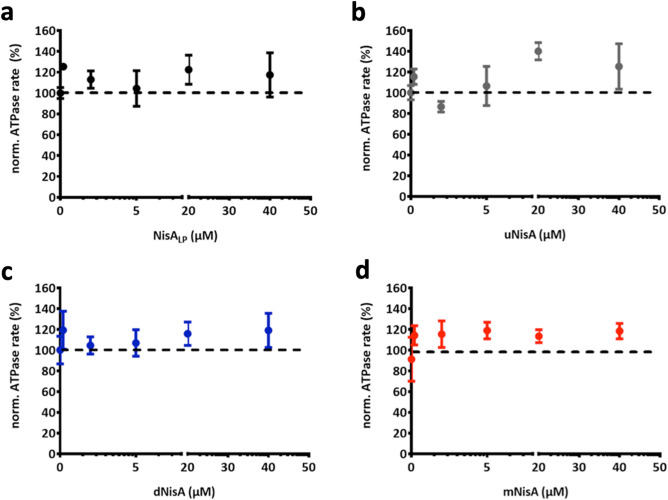
Dependence of NisT ATPase rate on different substrates. The ATPase rate of purified 10HNisT was analyzed in the presence of different substrates. (a) The leader peptide of NisA (NisALP, black dots), (b) uNisA (grey dots), (c) dNisA (blue dots) and (d) mNisA (red dots) was used in various concentrations (µM) and the ATPase rate is shown as normalized ATPase rate (%). The basal ATPase rate (from 10HNisT without any substrate; compare Fig. 3) was set as 100% (dashed line) and further values were normalized accordingly. The assays were performed in at least four independent experiments and are represented as means ± s.d. (n = 4). The means were analyzed by a one-way ANOVA and the differences were not significant (p-value: ≥ 0.05). ns: not significant.

