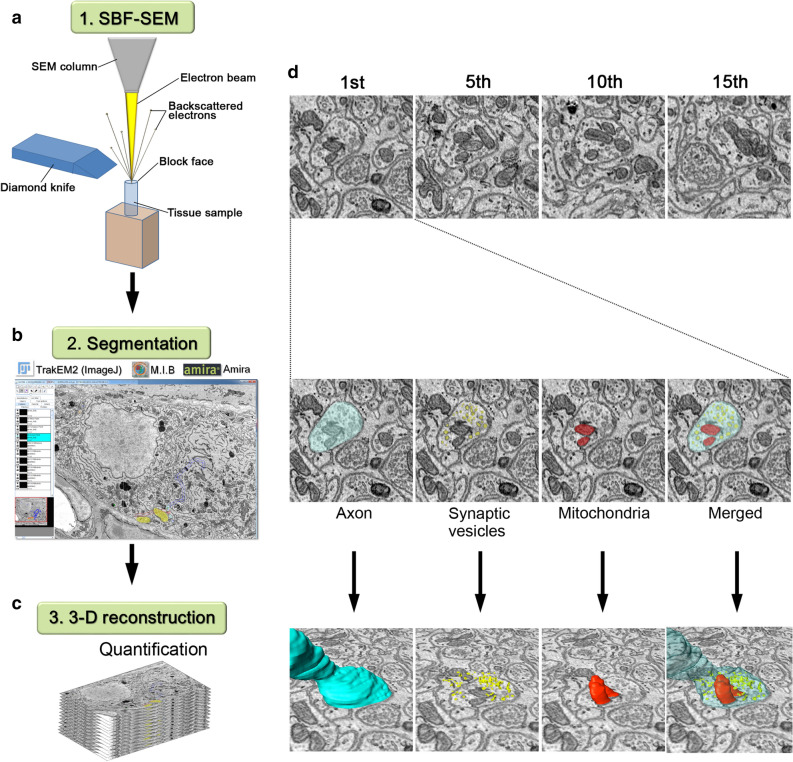
Figure 2.
Workflow for 3D reconstruction of axonal varicosities in the myenteric plexus. (a) A diamond knife (blue) was used cut 50- or 70-nm ultrathin slices from the top of the block-face in SEM (SBF-SEM). In this method, an image is captured after every retraction of the knife, and the cutting and imaging cycle is automatically repeated to acquire serial images. (b) SBF-SEM can produce a series of hundreds or even thousands of orthoslices where segmentation of various ultrastructures can be performed with different software. (c) Following acquisitions and semi-automatic or manual segmentation, orthoslice series and structures were rendered into 3D ultrastructure and quantified. (d) Top: representative (1st, 5th, 10th and 15th) images from an actual stack at 50-nm thickness. Middle: axon (light blue), synaptic vesicles (yellow), and mitochondria (red) were marked in semi-automatic and manual segmentation, and traced using TrakEM2 (https://imagej.net/TrakEM2), Amira version 5.6 (https://www.fei.com/software/amira/), and Microscopy Image Browser. Bottom: three-dimensionally (3D) rendered axon (blue), synaptic vesicles (yellow), mitochondria (red), and merged image.

