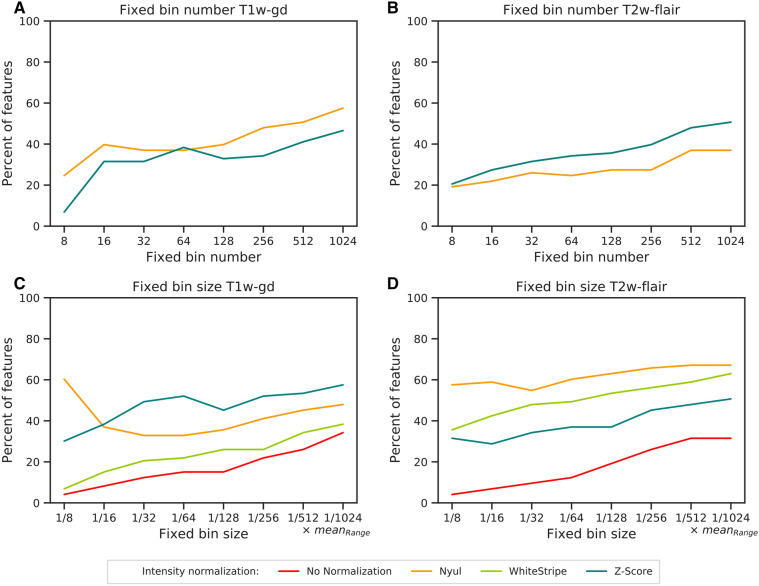
Figure 2.
Percentages of the 73 textural features showing ICCs and CCCs values > 0.8 depending on the intensity normalization and the discretization method. (A) FBN T1w-gd, (B) FBN T2w-flair, (C) FBS T1w-gd, (D) FBS T2w-flair. FBN fixed bin number (relative discretization), FBS fixed bin size (absolute discretization), ICC intra-class correlation coefficient, CCC cross correlation coefficient. In (A) and (B), the No Normalization, WhiteStripe and Z-Score line plots are confounded. In (C) and (D), the No Normalization, WhiteStripe and Z-Score line plots are separated.

