
Figure 1.
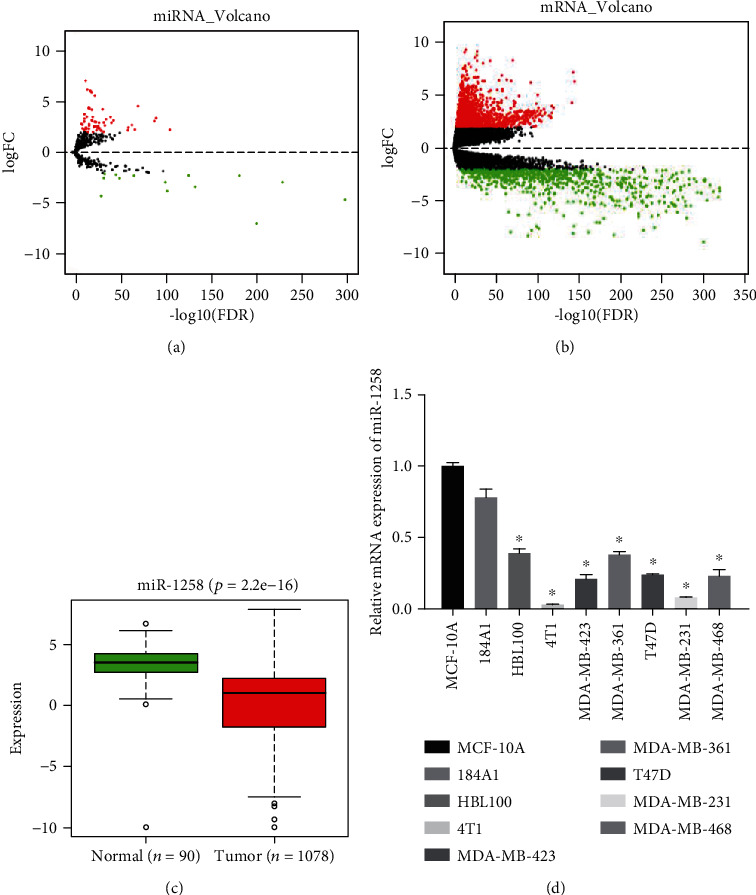
miR-1258 is poorly expressed in BC. (a, b) Volcano plots of DEmiRNAs and DEmRNAs in normal and tumor groups in the TCGA-BRCA dataset. Red dots indicate the upregulated miRNAs and mRNAs in BC, while green dots indicate the downregulated miRNAs and mRNAs. (c) Expression of miR-1258 in the normal and tumor groups in the TCGA-BRCA dataset. (d) Expression of miR-1258 in BC cells and breast epithelial cells. ∗ is compared to MCF-10A, p < 0.05.