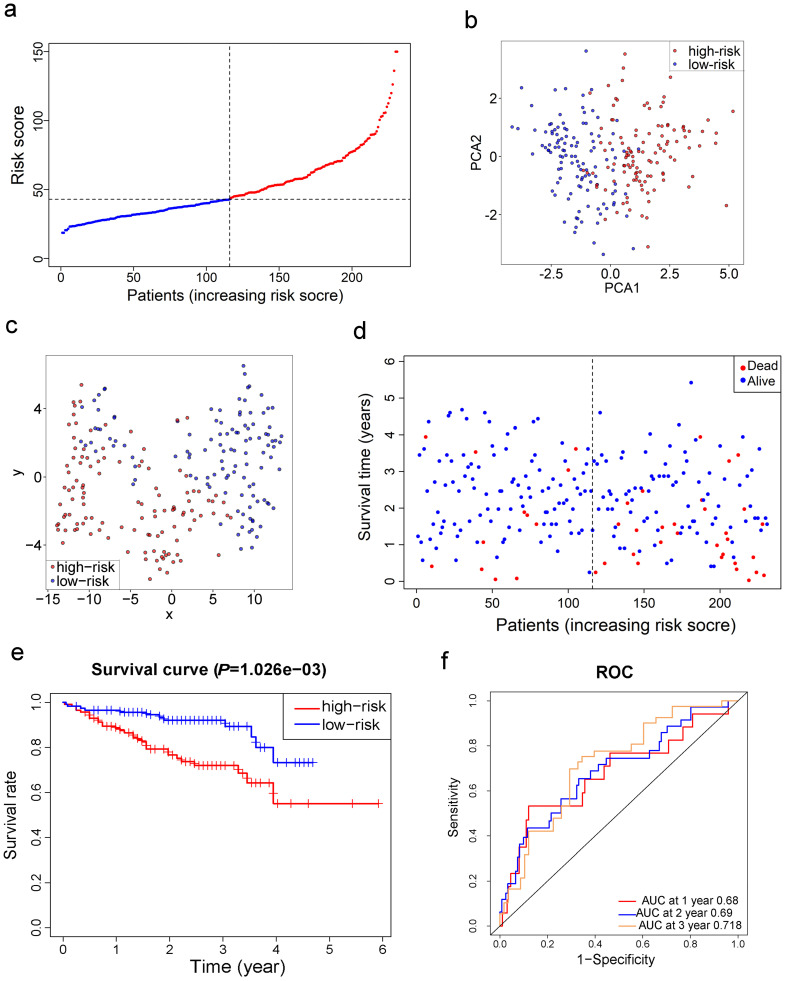
Figure 4.
Validation of the 10-gene signature in the ICGC cohort. a. The distribution and median value of the risk scores in the ICGC cohort. b. PCA plot of the ICGC cohort. c. t-SNE analysis of the ICGC cohort. d. The distributions of OS status, OS and risk score. e. Kaplan-Meier curves for the OS of patients in the high-risk group and low-risk group. f. AUC of time-dependent ROC curves in the ICGC cohort.

