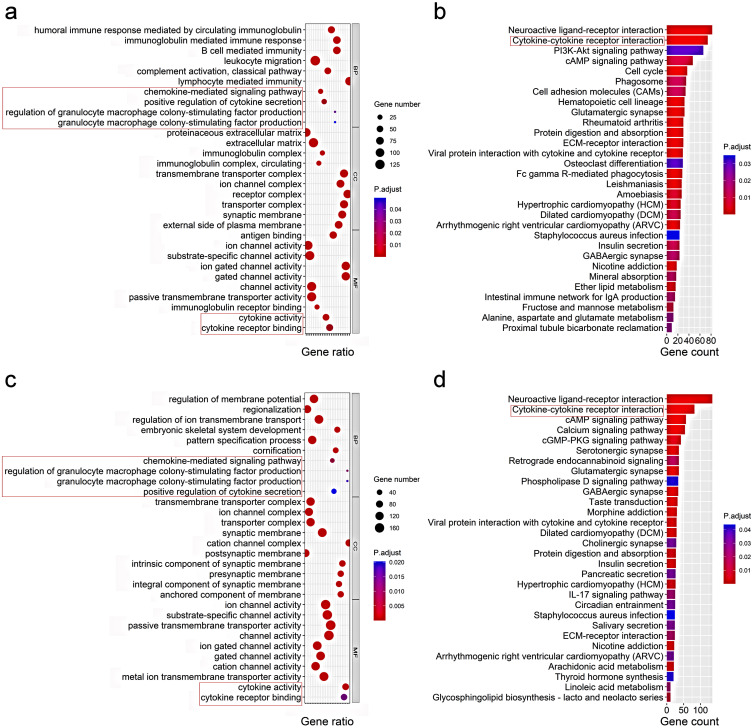
Figure 6.
Representative results of GO (a, c) and KEGG analyses (b, d) . The most significant or shared GO enrichment and KEGG pathways in the TCGA cohort (a, b) and ICGC cohort (c, d) are displayed. The pink rectangles indicate the immune-related pathways that are overlapped between the two cohorts.

