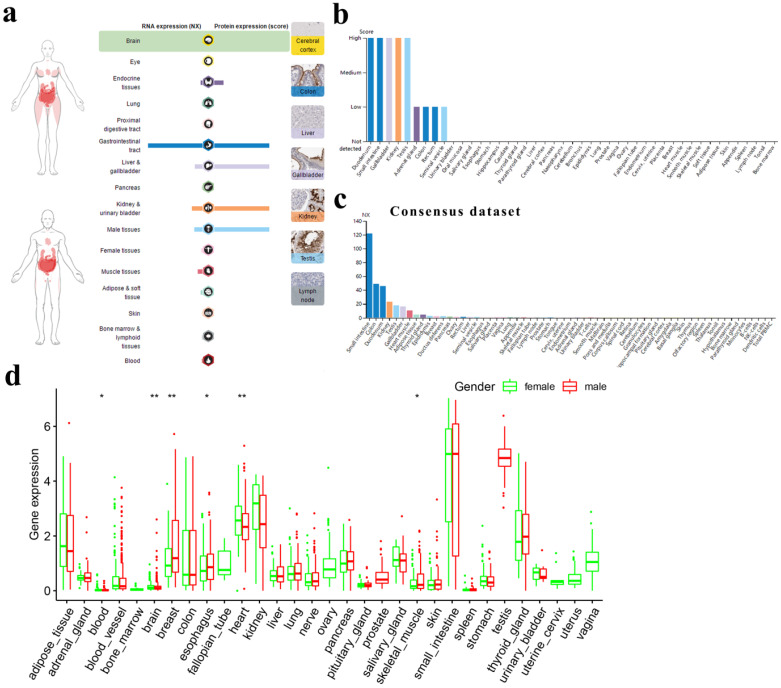
Figure 1.
ACE2 expression in normal human tissues. (a) Overview of RNA and protein expression data in the human body. Left panel: the depth of red represents the different expression levels. Middle panel: bars represent the highest NX (RNA expression) and expression score (protein expression) found in a particular group of tissues. Right panel: representative images of immunohistochemical staining for ACE2 in the normal cerebral cortex, colon, liver, gallbladder, kidney, testis and lymph node. (b) Protein expressions of ACE2 in normal tissues, which were ranked by the expression levels. The y-axis represents the scores based on immunohistochemistry. (c) RNA expressions of ACE2 in normal tissues, which were ranked by the expression levels. The data were from the consensus dataset based on a combination of all three sources (HPA RNA-seq data, GTEx RNA-seq data and FANTOM5 data). (d) Difference in ACE2 expression between men and women from GTEx data. The y-axis represents transformed log2(FPKM+1). NX, consensus normalized expression; HPA, Human Protein Atlas; GTEx, Genotype-Tissue Expression; FPKM, number of fragments per kilobase of exon per million reads. *, P < 0.05; **, P < 0.01.

