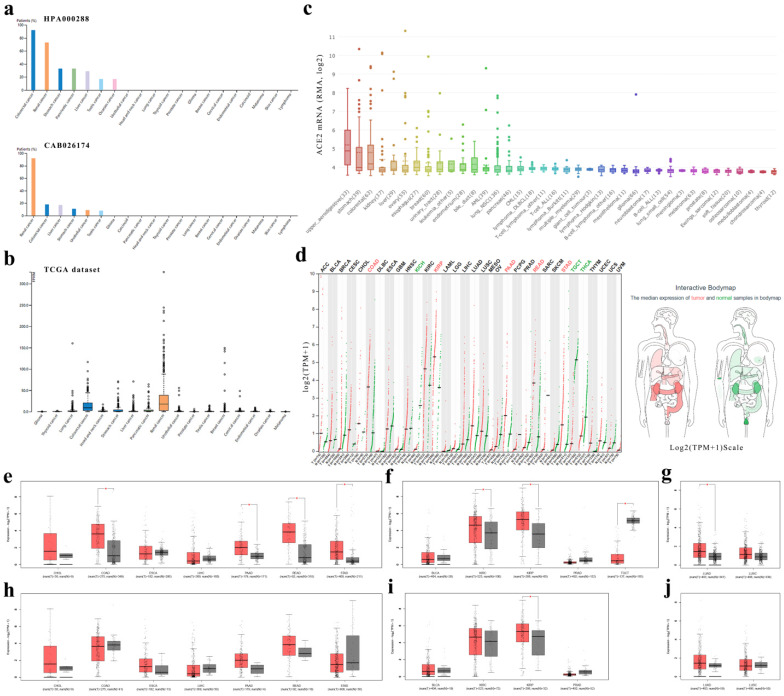
Figure 2.
ACE2 expression levels in human cancers. (a) The protein expressions of ACE2 in cancer tissues, which were ranked by the expression level, as assessed by HPA000288 and CAB026174 antibodies. The y-axis represents the percent of patients (maximum 12 patients) with high or medium expression levels. The data were obtained from the pathology atlas. (b) Overview of RNA expressions in different cancers. The data were obtained from the TCGA dataset in the pathology atlas. (c) Box plot showing the mRNA expression levels of ACE2 in human cancer cell lines from the CCLE database. Within each box, the median is a solid line, while the mean is a dashed line. (d) Bar plot and interactive body map of ACE2 expression levels in cancer samples and matched normal samples through GEPIA (TCGA normal + GTEx normal); each dot represents a sample. (e-j) Boxplot showing ACE2 expressions in human cancer and matched normal tissue (TCGA normal + GTEx normal) (e-g) or in human cancer and adjacent normal tissue (TCGA) (h-j), as obtained using GEPIA. The y-axis represents transformed log2(TPM+1). The |log2FC| cutoff is 0.5 and the p-value cutoff is 0.05. The jitter size is 0.4 (red color: cancer samples; gray color: normal samples). RMA, Robust Multi-array Average; CCLE, Cancer Cell Line Encyclopedia; TPM, transcripts per million; TCGA, The Cancer Genome Atlas; GTEx, Genotype-Tissue Expression; GEPIA, Gene Expression Profiling Interactive Analysis; CHOL, cholangiocarcinoma; COAD, colon adenocarcinoma; ESCA, esophageal carcinoma; LIHC, liver hepatocellular carcinoma; PAAD, pancreatic adenocarcinoma; READ, rectum adenocarcinoma; STAD, stomach adenocarcinoma; BLCA, bladder urothelial carcinoma; KIRC, kidney renal clear cell carcinoma; KIRP, kidney renal papillary cell carcinoma; PRAD, prostate adenocarcinoma; TGCT, testicular germ cell tumor; LUAD, lung adenocarcinoma; LUSC, lung squamous cell carcinoma.

