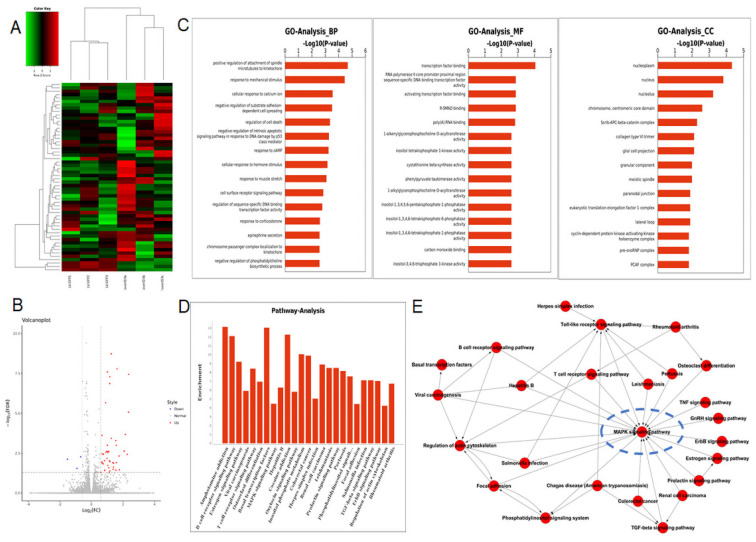
Figure 6.
RNA-seq analysis data after Id3 was overexpressed in Eca109 cells. (A, B) Heatmap and volcano plot of differentially expressed transcripts. (C, D) Gene ontology analysis (C) and pathway analysis (D) based on all identified transcripts. (E) Pathway-act network of all pathways according to pathway database.

