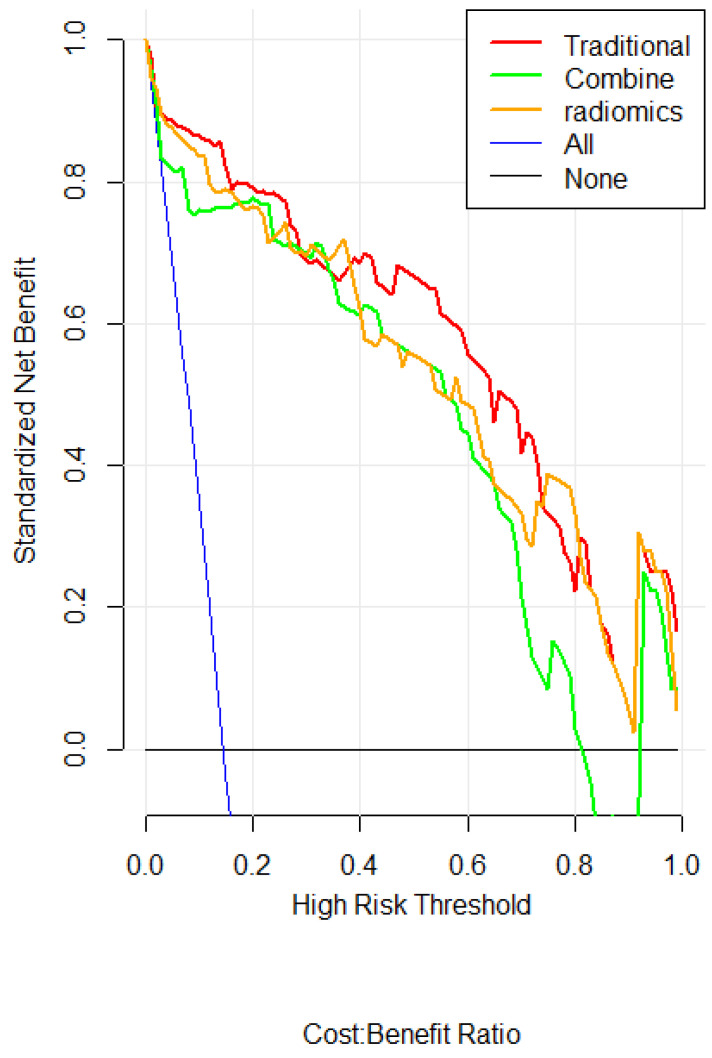
Figure 7.
DCA for the radiomics nomogram. The y-axis represents the net benefit. The red, green and orange line represents the traditional, radiomics and combined model, respectively. The blue line represents the hypothesis that all patients had ARDS. The black line represents the hypothesis that no patients had ARDS. The x-axis represents the threshold probability. The threshold probability is where the expected benefit of treatment is equal to the expected benefit of avoiding treatment. For example, if the possibility of ARDS existence of a patient is over the threshold probability, then a treatment strategy for ARDS should be adopted.

