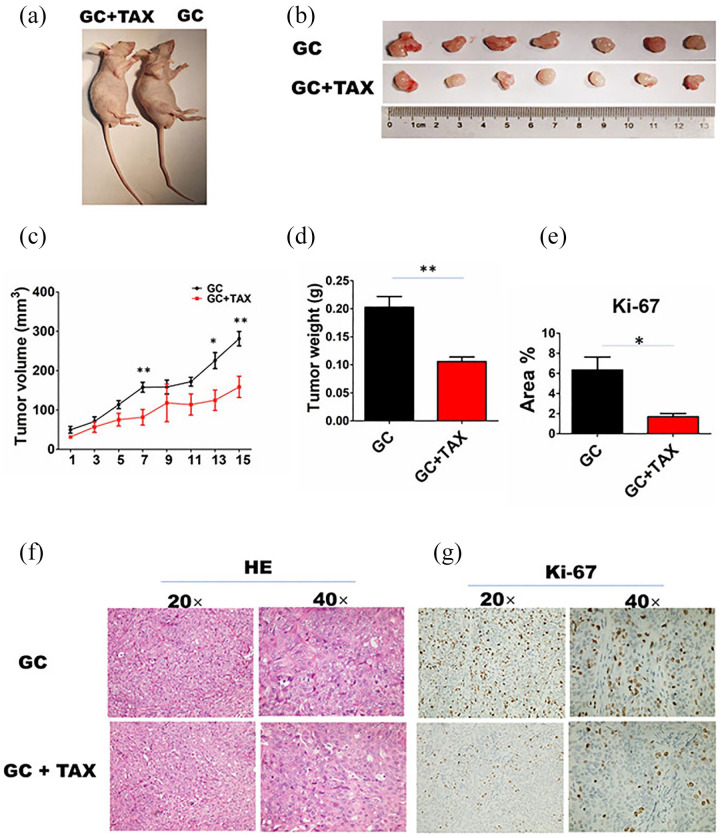
Figure 2.
TAX inhibited the growth of GC cells in vivo. (a) Representative schematic of the mice in different groups. (b) Macroscopic appearance of the tumor tissues. ((c) and (d)) Comparison of the mean tumor volume and weight between the two groups (n = 7). (f) The histopathological changes in tumor tissues were examined by H&E staining (20×, 40×). ((e) and (g)) The protein expression levels of Ki-67 were verified by IHC analysis in tumor tissues in the two groups. Data are the means ± SEM of two experiments.
*P < 0.05; **P < 0.01.

