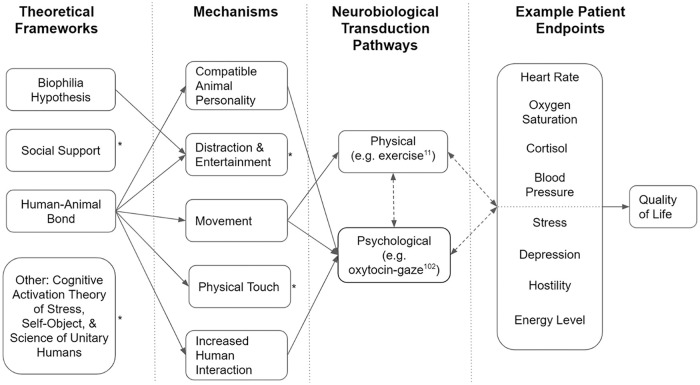
Figure 1.
Diagram of multilayered benefit hypothesis example for animal-assisted interaction in oncology.
*Arrows for this concept removed for simplicity. Though not shown here, each framework could potentially extend to other mechanisms on further investigation by researchers.
**Solid, single arrows indicate potential directionality between concepts, while dashed, double arrows indicate interplay or feedback loops between concepts.

