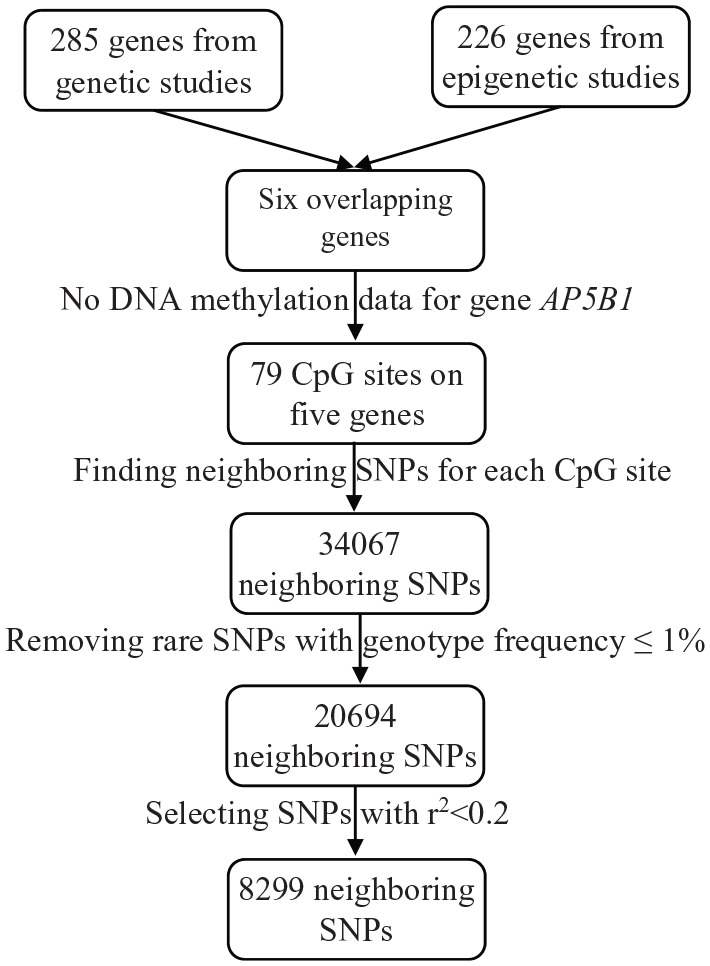
Figure 1.

The flowchart of selecting neighboring SNPs for methQTL analyses based on window size of 1M bps.
bps indicates base pairs; CpG, 5′-C-phosphate-G-3′; methQTL, methylation quantitative loci; SNP, single-nucleotide polymorphism.

The flowchart of selecting neighboring SNPs for methQTL analyses based on window size of 1M bps.
bps indicates base pairs; CpG, 5′-C-phosphate-G-3′; methQTL, methylation quantitative loci; SNP, single-nucleotide polymorphism.