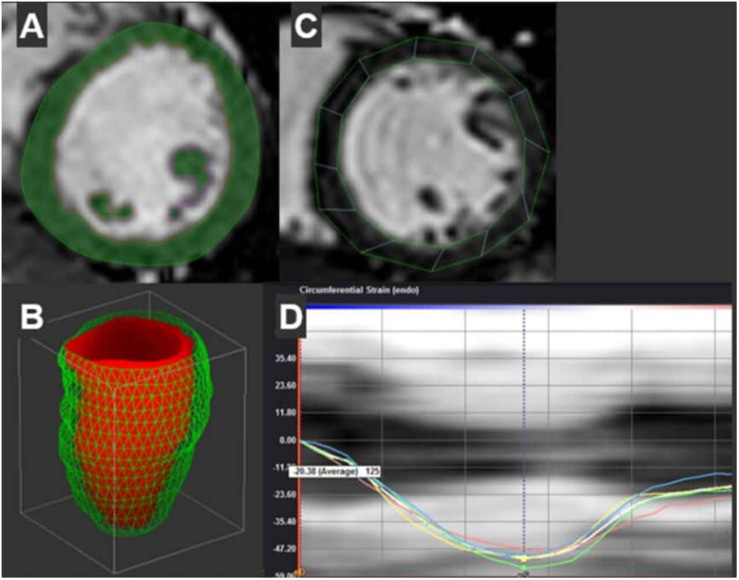
FIGURE 4.
Representative contours of the left ventricle and subsequent measures are shown. (A) Semi-automated contours with manual adjustment are combined with Qmass’s threshold based mass detection (green shading) for each short axis slice of the ventricle. These slices create a 3D re-construction of the LV volumes by method of discs (Diastolic volume shown in Panel B). (C) Separate contours at the mid-section of the ventricle are used to measure circumferential strain through the cardiac cycle using Tomtec’s semi-automated feature tracking algorithm. (D) Shows both segmental strain curves. Peak strain of the mid-section is shown in white.

