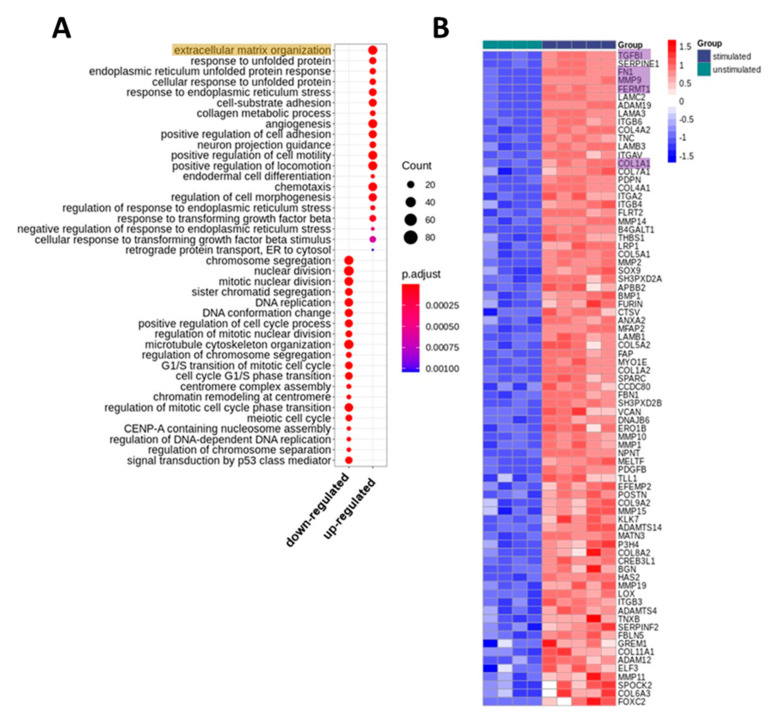
Figure 1.
Transcriptomic changes in keratinocytes induced by stimulation with platelet-released growth factor (PRGF). (A) Gene Ontology (GO) biological processes that were enriched with genes differentially expressed in PRGF-stimulated vs. unstimulated keratinocytes. The top 20 (according to p-value) significantly enriched biological processes for up- and downregulated genes, respectively, are shown. The size of the dots displays the number of differentially expressed genes among the particular biological process. The color displays the adjusted p-values. (B) Heatmap of genes differentially expressed in stimulated vs. unstimulated keratinocytes from the top enriched GO biological process “extracellular matrix organization.” The color code displays row Z-score. The genes are ordered by log2 fold change and expression level over all samples, that is, the top genes revealed high log2 fold changes together with high expression. The expression of the highlighted genes was further analyzed in detail (see below).

