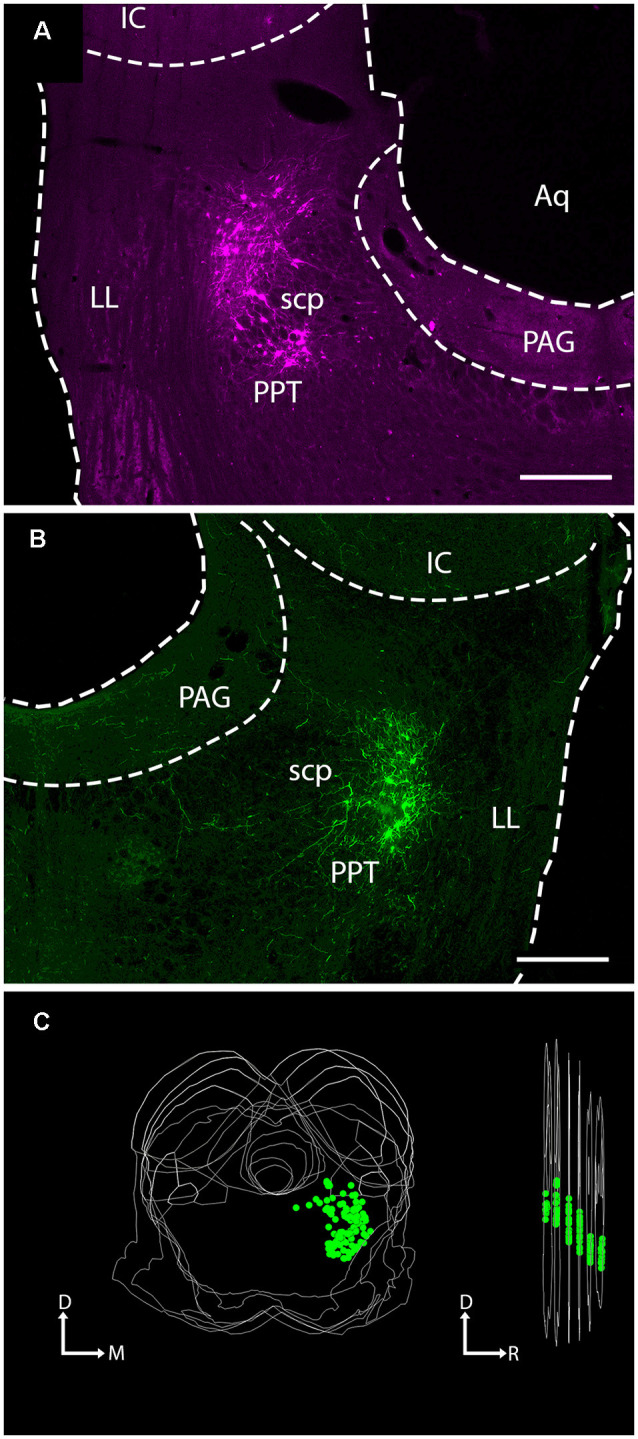
Figure 1.

Injection of viral vector into the PPT of ChAT-Cre transgenic rats labeled neurons at the site of injection. Photomicrographs show virally-expressed fluorescent protein in PPT neurons. (A) A representative example of mCherry expression in neurons of the left PPT following injection of rAAV2/EF1a-DIO-mCherry. Transverse section; lateral is left, dorsal is up. Scale bar = 500 μm. (B) A representative example of EYFP expression in neurons of the right PPT following injection of rAAV2/EF1a-DIO-EYFP. Transverse section; lateral is right, dorsal is up. Scale bar = 500 μm. (C) A representative three-dimensional reconstruction showing the extent of labeled neurons in the PPT through six transverse sections (spacing: 240 μm between sections). The image on the left shows the six sections stacked, with each EYFP-labeled cell indicated by a green circle. The image on the right shows the stack rotated for a lateral view. The “cloud” of labeled cells shifts ventrally moving from caudal to rostral, reflecting the orientation of the PPT. Aq, cerebral aqueduct; D, dorsal; IC, inferior colliculus; LL, lateral lemniscus; M, medial; PAG, periaqueductal gray; PPT, pedunculopontine tegmental nucleus; R, rostral, scp, superior cerebellar peduncle.
