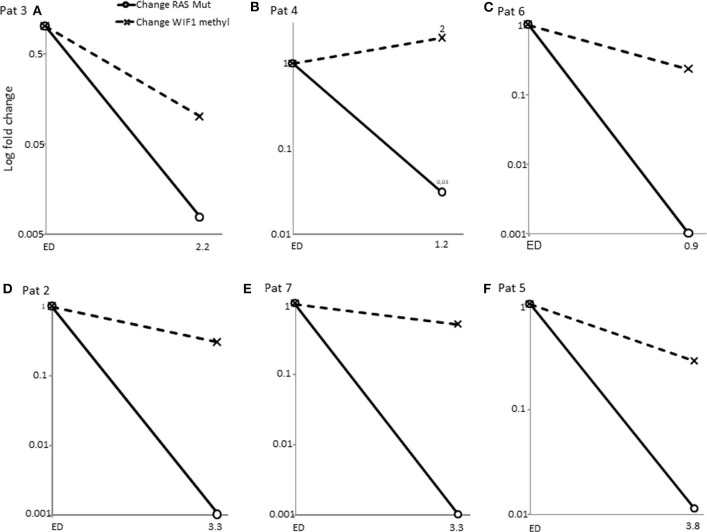
Figure 3.
Change of WIF1 promotor methylation proportion vs. change of RAS mutational allele frequency. Samples of patients at the diagnosis time points vs. samples of the time point of disappearance of RAS mutations were measured by methylation specific ddPCR (see Supplementary File). WIF1 promotor methylation proportion remained detectable in samples with massive RAS MAF% reduction. (A–F) (solid line with circle, change of RAS mutant allele frequency; dashed line with cross, change of WIF1 promotor methylation proportion).

