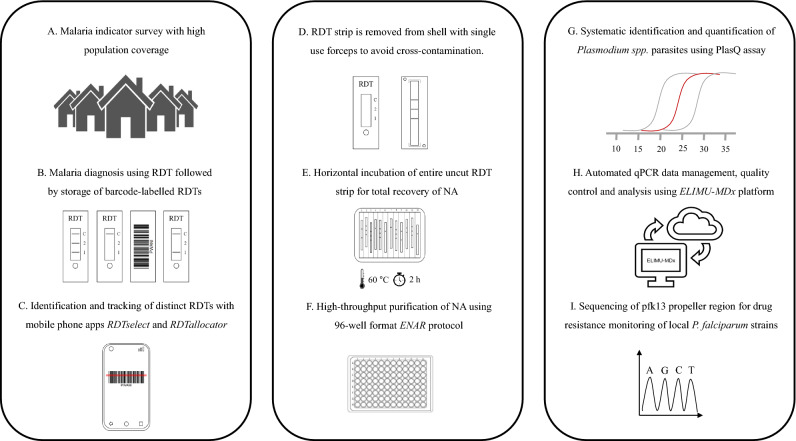
Figure 3.
Adaptation of ENAR protocol for analyzing large numbers of barcoded RDTs. (A) Malaria indicator survey conducted including a detailed questionnaire. (B) Malaria prevalence is determined by RDT followed by storage of barcode-labelled RDTs. (C) Sorting and tracking of RDTs using smartphone apps. (D–F) High throughput protocol for extraction of NAs from RDTs using the ENAR approach (Image courtesy of LJNovaScotia/Pixabay). (G) Detection and quantification of Pf and non-Pf malaria parasite. (H) Automated analysis of qPCR data using ELIMU-MDx. (I) Genotyping of pfk13 propeller region for drug resistance monitoring.

