Figure 9.

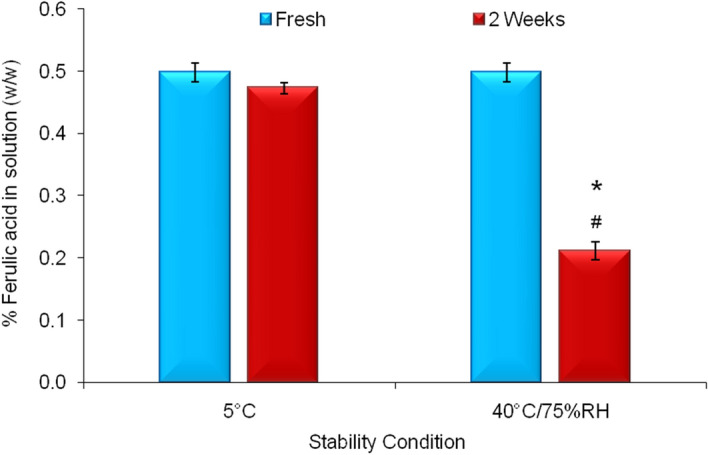
Stability profile of ferulic acid aqueous solution at 5 °C and 40 °C/75% RH. Data represent mean ± SD (n = 3). Significant difference (p < 0.05): *Fresh versus 2 weeks at 40 °C/75% RH. #2 weeks at 40 °C/75% RH versus 2 weeks at 5 °C.

Stability profile of ferulic acid aqueous solution at 5 °C and 40 °C/75% RH. Data represent mean ± SD (n = 3). Significant difference (p < 0.05): *Fresh versus 2 weeks at 40 °C/75% RH. #2 weeks at 40 °C/75% RH versus 2 weeks at 5 °C.