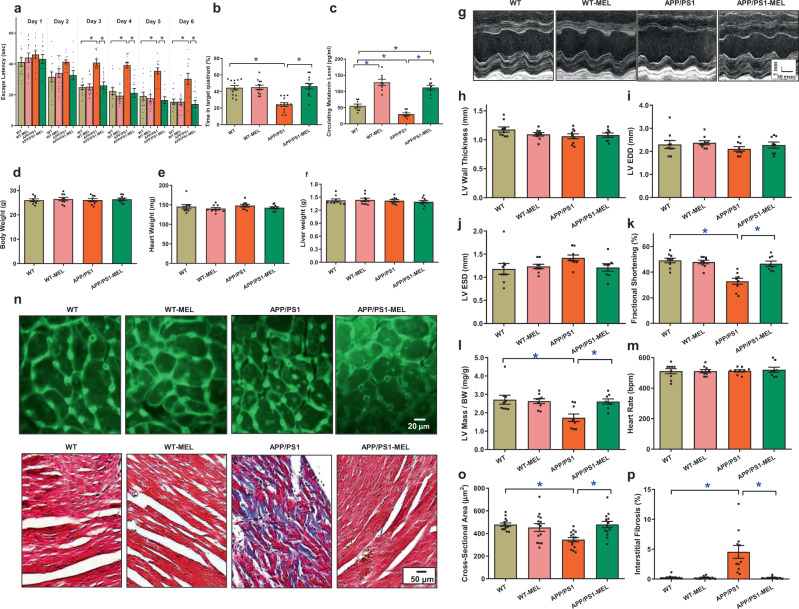
Fig. 2.
The effect of melatonin (20 mg/kg/day, p.o., 6 weeks) on WT mice and APP/PS1 mice with Alzheimer’s disease. a Escape latency; b time in target quadrant (%); c circulating melatonin level; d body weight; e hHeart weight; f liver weight; g representative image of echocardiography; h left ventricular (LV) wall thickness; i LV end diastolic volume (LVEDD); j LV end systolic volume (LVESD); k fractional shortening; l LV mass/body weight; m heart rate; n representative images of lectin staining showing cardiomyocyte atrophy (×200) and Masson’s trichrome staining depicting fibrosis (×100); o quantitative analysis of cardiomyocyte cross-sectional area; and p quantitative analysis of fibrotic area (Masson’s trichrome-stained area in light blue was normalized to total cardiac area). The data are shown as the mean ± SEM, n = 7–14 mice per group. *p < 0.05 between the indicated groups

