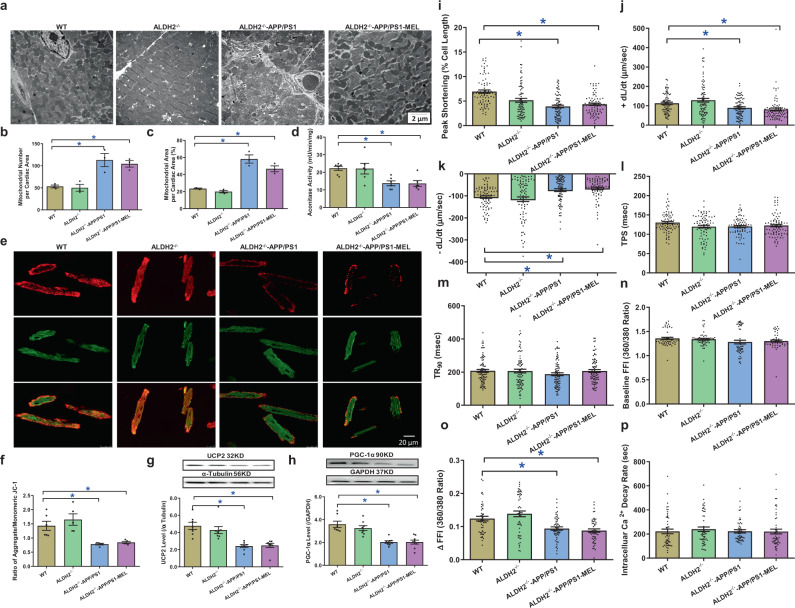
Fig. 5.
Mitochondrial abnormalities, contractile properties, and intracellular Ca2+ homeostasis of cardiomyocytes in WT, ALDH2−/−, ALDH2−/−-APP/PS1 mice, and ALDH2−/−-APP/PS1 mice treated with melatonin (20 mg/kg/day, p.o., 6 weeks). a Representative transmission electron microscopy (TEM) images showing the ultrastructural findings; b mitochondrial number per cardiac area (×6000); c percentage of mitochondrial area per cardiac area (×6000); d aconitase activity; e representative image of JC-1; f ratio of aggregate/monomeric JC-1; g UCP2 expression; h PGC-1α expression; i peak shortening (normalized to cell length); j maximal velocity of shortening (+dL/dt); k maximal velocity of relengthening (−dL/dt); l Time-to–peak shortening (TPS); m time-to-90% relengthening (TR90); n resting fura-2 fluorescence intensity (FFI); o electrically stimulated rise in FFI (ΔFFI); and p single exponential intracellular Ca2+ decay. The data are shown as the mean ± SEM, n = 3 mice per group for b, c, n = 4–7 mice per group for d–f, n = 6–8 mice per group for g, h, n = 80 cells from 5 mice (∼15–20 cells per mouse) per group for i–m, and n = 50 cells from 5 mice (∼10–15 cells per mouse) per group for n–p. *p < 0.05 between the indicated groups

