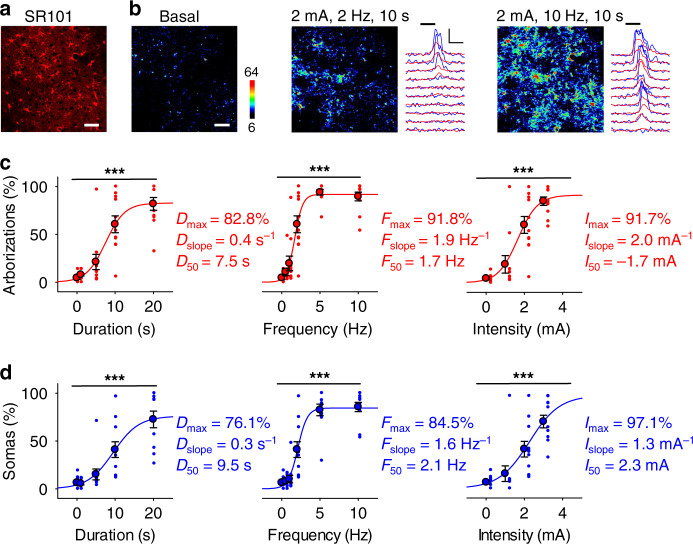
Fig. 2. Astrocyte population responses are stimulus dependent.
a SR101 staining. Scale bar = 50 µm. b Pseudocolor Ca2+ images with Ca2+ traces of arborizations (red) and somas (blue) before (basal) and during sensory stimulation with indicated parameters. Scale bar = 50 µm. Scale = ΔF, 10 s. Horizontal black bars indicate sensory stimuli. c Arborization responses vs. stimulus duration (D), frequency (F) and intensity (I), (1-way ANOVAs: duration: p = 4.7e−13; frequency: p = 5.3e−23; intensity: p = 2.0e−10; n = 11 imaging planes, 4 mice). Data were fit to the sigmoid function in Eq. (1) (see Methods section), where Dmax, Fmax, and Imax were the maximum responses for the respective stimulus parameter; Dslope, Fslope, and Islope were the respective slopes, which are considered as indicative of the astrocyte discrimination of the sensory stimuli, i.e., how the astrocyte activity response changes as the stimulus changes; and D50, F50, and I50 were the stimulus parameter values at which astrocyte responses were 50% of the maximum values, which was considered as indicative of astrocyte sensitivity of sensory stimuli. d as in c, but for somas (1-way ANOVAs: duration: p = 1.0e−10; frequency: p = 3.3e−21; intensity: p = 1.6e−7; n = 11 imaging planes, 4 mice). Means ± SEM, ‘***’: p < 0.001, 1-way ANOVA. Representative images and traces are in line with independent experiments carried out in 4 mice. Source data are provided as a Source Data file.

