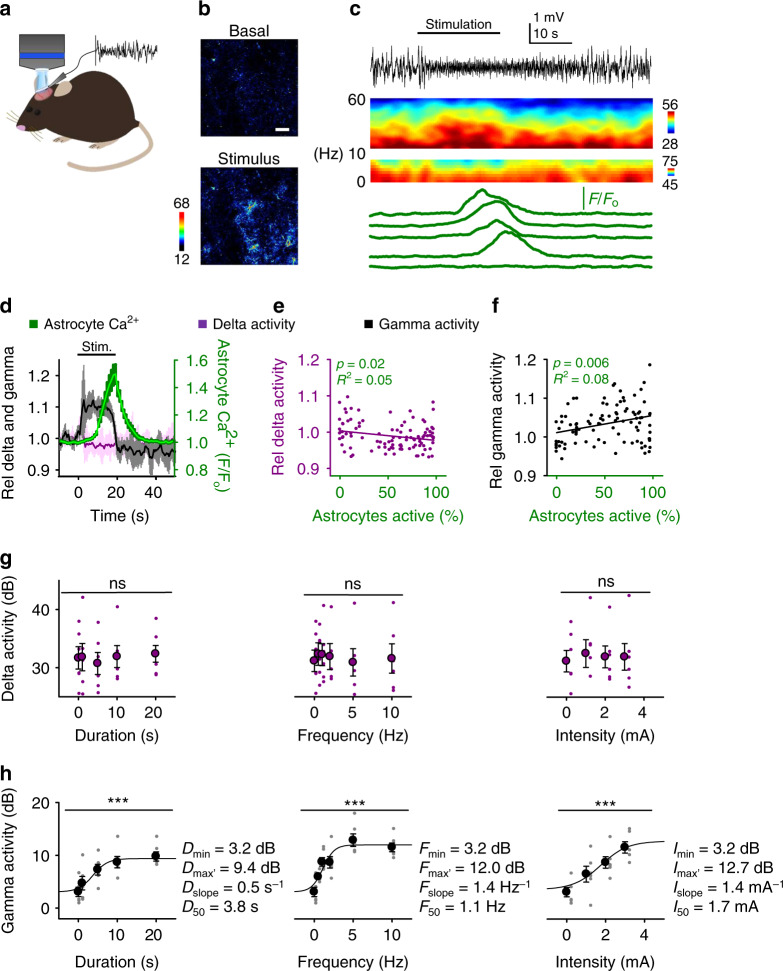
Fig. 3. Cortical astrocyte activity co-occurs with increases in gamma activity during sensory stimulation.
a Scheme of simultaneously recording astrocyte Ca2+ and ECoG in vivo. b Representative pseudocolor Ca2+ images of basal astrocyte activity and during hindpaw stimulation. Scale bar = 50 µm. c ECoG recording (black top trace), spectrograms (middle), and astrocyte Ca2+ levels (green bottom traces). d Astrocyte Ca2+ levels (green), relative gamma (30–50 Hz; black) and delta (0–4 Hz; purple) activity vs. time. Lines and shadows represent mean and SEM, respectively, as in other figures. e Relative delta activity vs. percentage of active astrocytes (n = 100 imaging planes, 3 animals). f as e but for relative gamma activity instead of relative delta activity. g Steady-state delta activity vs. the duration (D; left), frequency (F; center) and intensity (I; right) of the sensory stimulation (1-way ANOVA: duration: p = 0.21, frequency: p = 0.49, intensity: p = 0.17; n = 6 animals). h as g, but gamma activity instead of delta activity (1-way ANOVA: duration: p = 0.0005, frequency: p = 1.0e−7, intensity: p = 0.0004; n = 6 animals). Data were fit to the sigmoid function in Eq. (2) (see Methods section), where Dmax, Fmax, and Imax were the response maximum values over Dmin, Fmin, and Imin (i.e., the minimum value of the respective stimulus parameter), Dslope, Fslope, and Islope were the respective slopes; and D50, F50, and I50 were the stimulus parameter values at which responses were 50% of the maximum values. Mean ± SEM. ns: p > 0.05 and ***: p < 0.001 using 1-way ANOVA. Source data are provided as a Source Data file.

