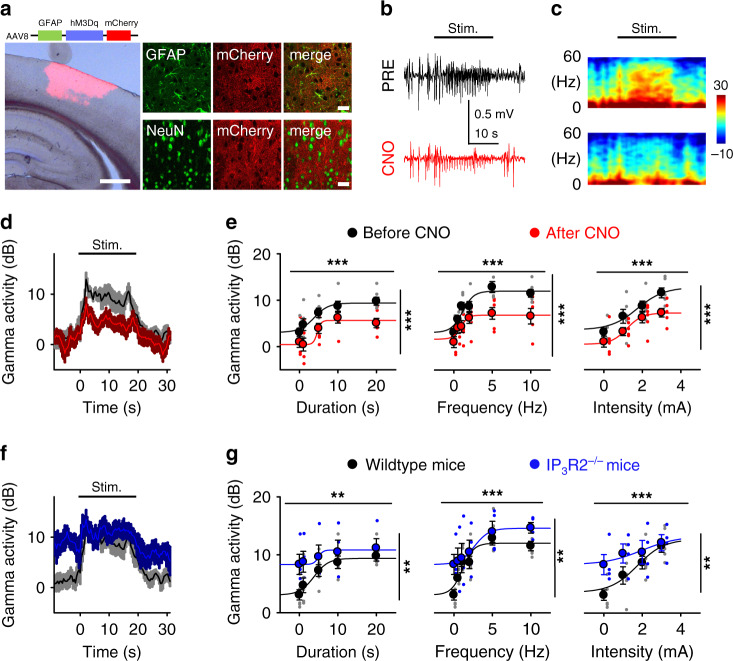
Fig. 5. Astrocytes modulate neuronal network response to sensory stimulation.
a Viral expression of DREADDs in S1 astrocytes. Scale bars = 500 µm, 10 µm. b ECoG recordings during hind paw stimulation before (black top trace, PRE) and after (red bottom trace, CNO) i.p. injection of CNO. Images and traces are representative of independent experiments from 6 mice. c Spectrograms of b. d Gamma activity vs. time before (black) and after CNO (red). Lines and shadows represent mean and SEM, respectively, as in other panels. e Gamma activity vs. the duration, frequency and intensity of the sensory stimulation before (black) and after CNO (red) injection (duration: 2-way ANOVA for stimulus: p = 1.9e−6, for CNO: p = 1.3e−5; frequency: 2-way ANOVA for stimulus: p = 1.9e−8, for CNO: p = 1.1e−6; intensity: 2-way ANOVA for stimulus: p = 2.9e−7, for CNO: p = 3.4e−4; n = 6 animals). Data were fit to the sigmoid function in Eq. (2) (see Methods section; see Supplementary Table 2 for fitting parameters). f–g, as d–e, but in wildtype (black) and IP3R2−/− (blue) mice (duration: 2-way ANOVA for stimulus: p = 0.001, for genotype: p = 0.001; frequency: 2-way ANOVA for stimulus: p = 1.3e−7, for genotype: p = 0.002; intensity: 2-way ANOVA for stimulus: p = 0.0004, for genotype: p = 0.007; n = 6 animals). Note that data of before CNO and wildtype are the same. Mean ± SEM. ‘***’: p < 0.001 and ‘**’: p < 0.01 for 2-way ANOVA. Source data are provided as a Source Data file.

