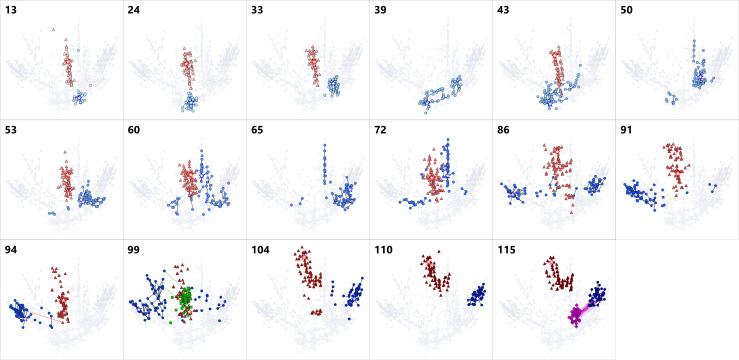
Figure 3. Series of snapshots of dominant RNA genotypes on 2D maps for the host RNA, parasite-α, -β and -γ.
The upper-left numbers indicate the round. The top 90 dominant genotypes of each RNA species were plotted for each round. A point represents each genotype. The colors of points are consistent with Figure 2, the host (blue), parasite-α (red), -β (green), and -γ (purple). A star in each figure represents the most frequent genotype of the host (blue), parasite-α (red), -β (green), and -γ (purple). Black lines connect pairs of points one Hamming distance apart in the same RNA species. A broken line connects a pair of points zero Hamming distance apart in the different RNA species, ignoring the large deletion, which represent a plausible generation route of each parasite. Colors of the broken lines correspond to the host and parasite-α (red), the host and parasite-β (green), and the host and parasite-γ (purple). Parasite-α is not shown in the round-39, 50, and 65 because they could not have been recovered and sequenced.

