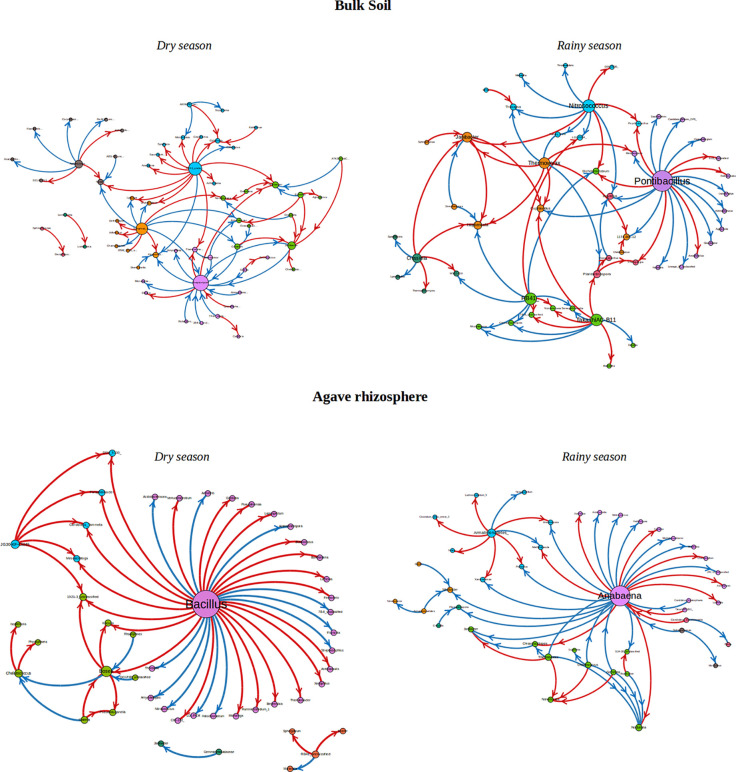
Figure 4.
Interaction networks found for Rhizosphere and bulk soil over two seasons. The size of the nodes represents the importance in the network, i.e. the bigger the node is the more connections it has with other OTUs. Red rows are negative interactions, while blue rows are positive interactions. The color of each node represents the community to which it belongs.

