
Figure 2. Kaplan-Meier Survival Curves.
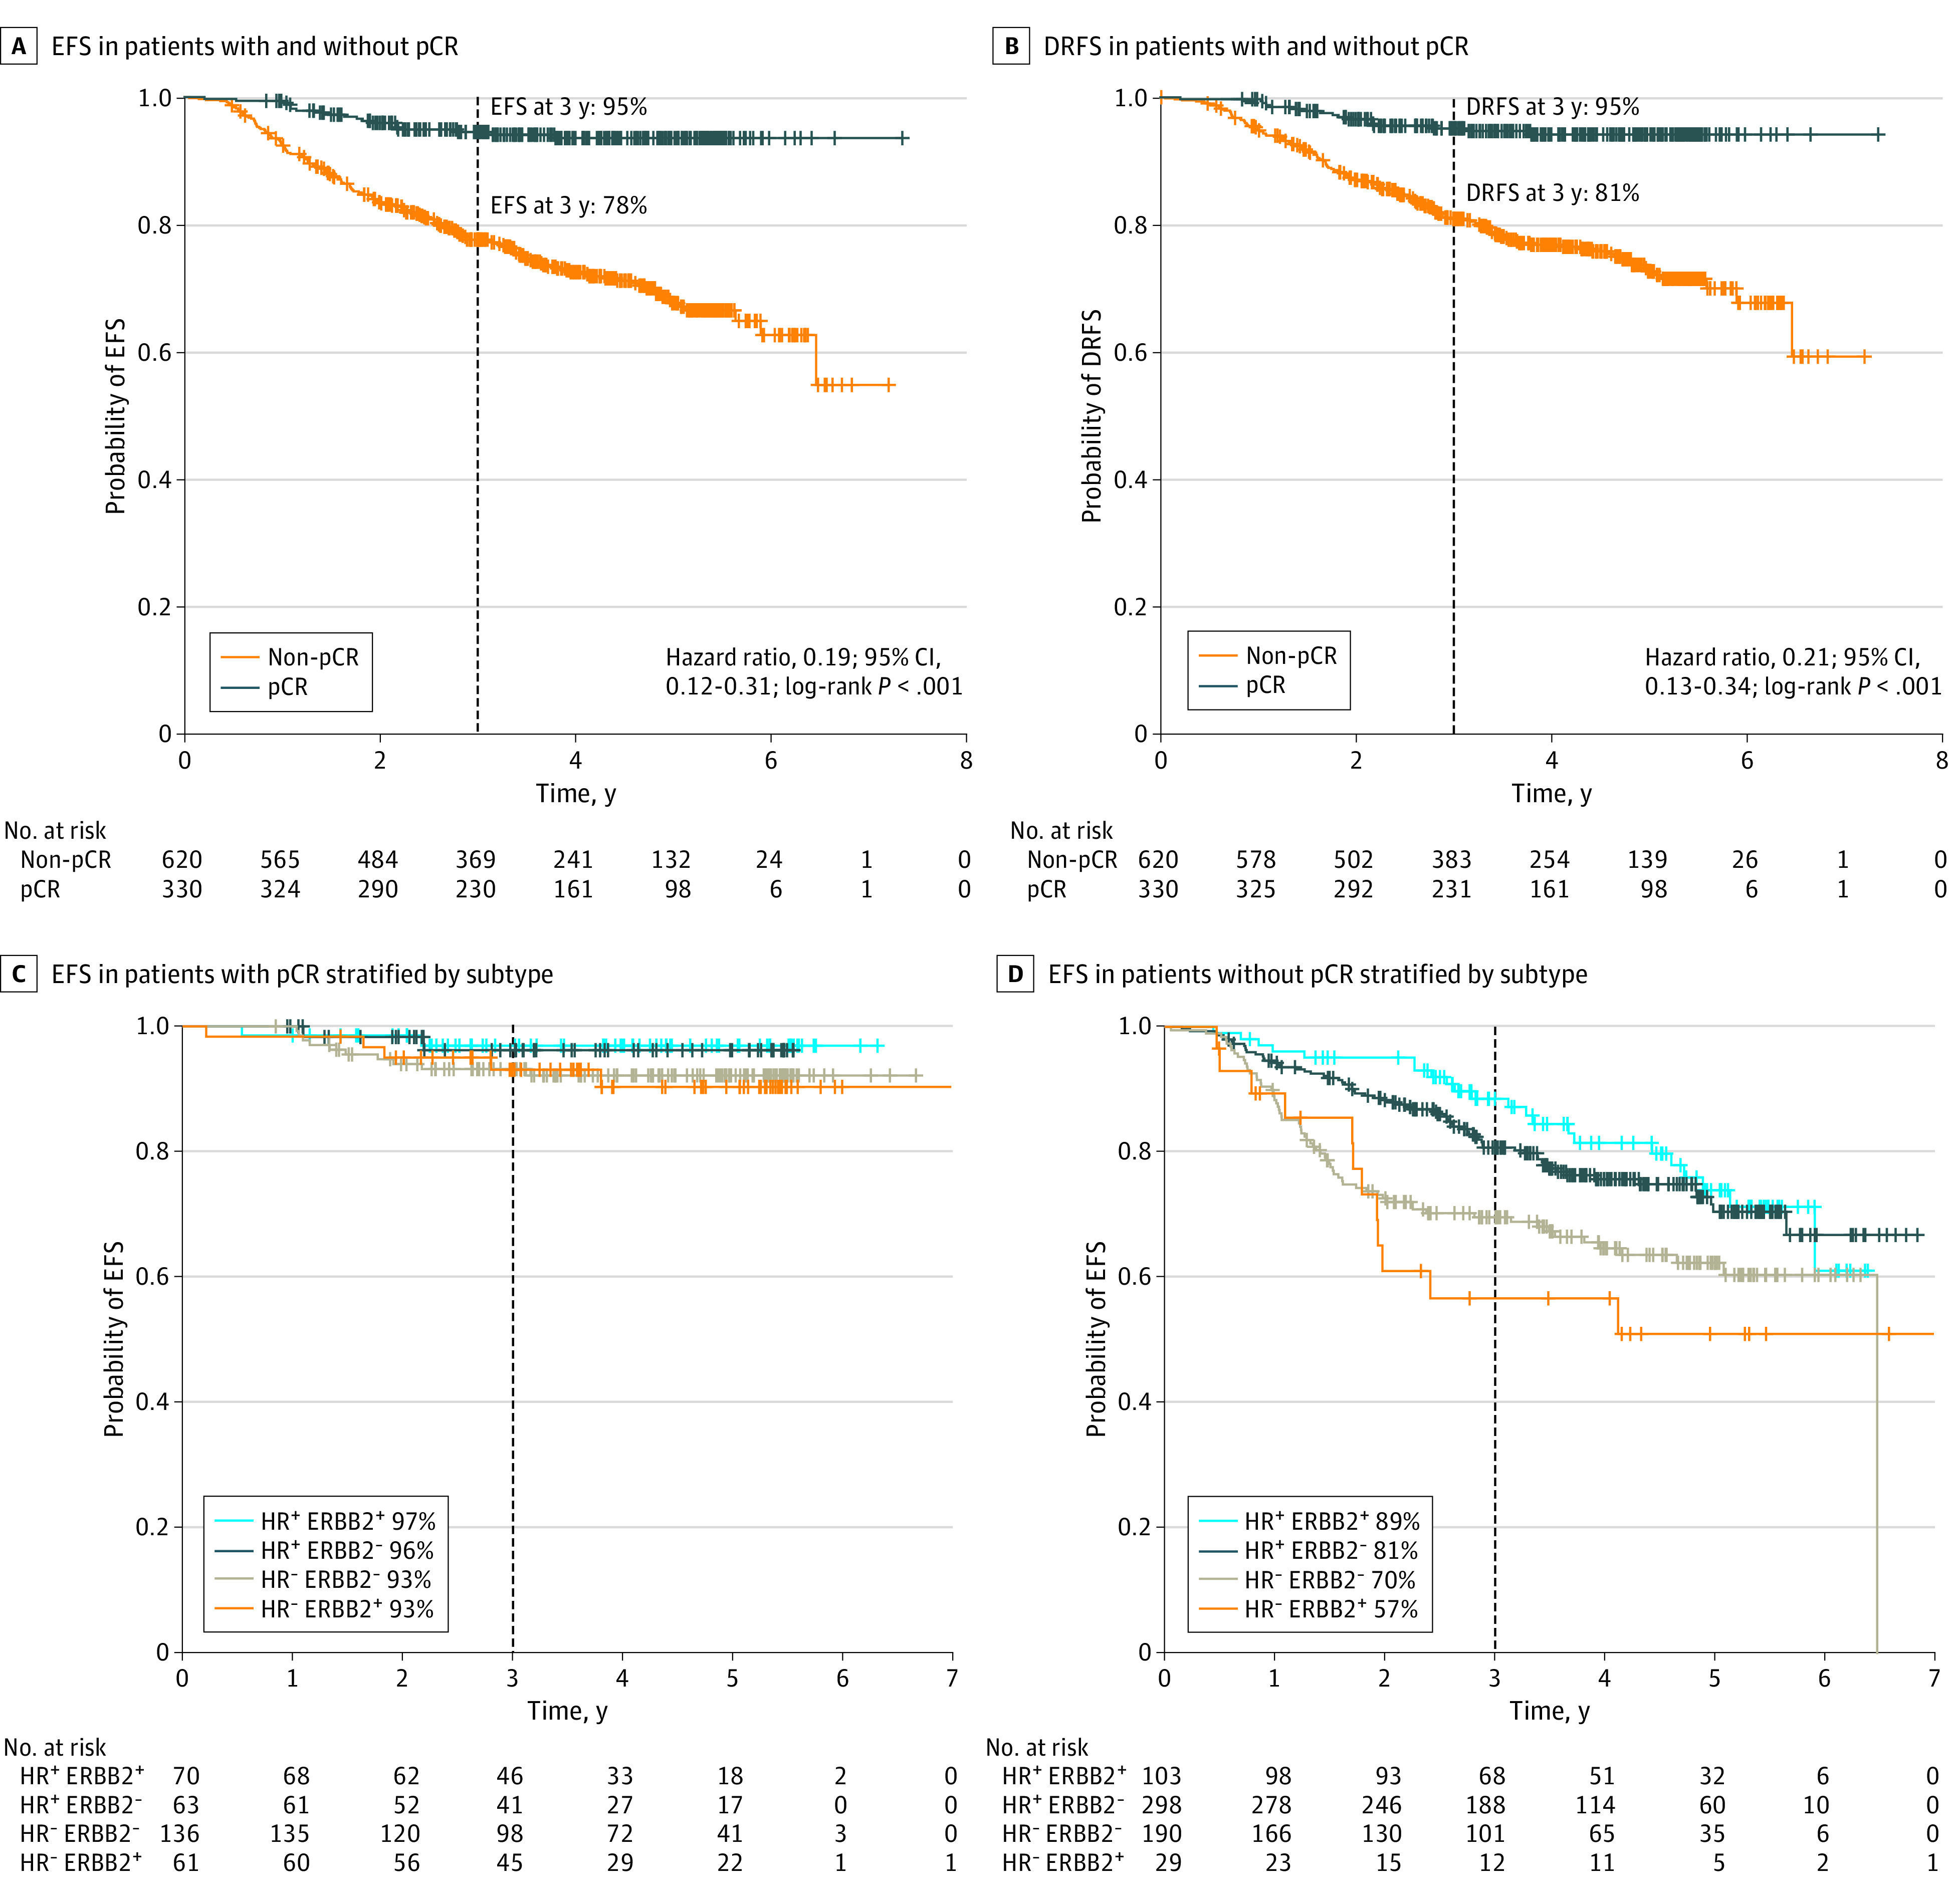
Kaplan-Meier survival curves for event-free survival (EFS) (A), and distant recurrence–free survival (DRFS) (B), in populations achieving pathologic complete response (pCR) at surgery (gray) and those with residual disease at time of surgery (orange). Kaplan-Meier survival curves for EFS among patients achieving pCR (C) and those who did not (D), stratified by hormone receptor (HR) and ERBB2 subtype (HR+ ERBB2+: light blue; HR+ ERBB2−: dark blue; HR− ERBB2−: gray; HR− ERBB2+: orange).