Figure 1.
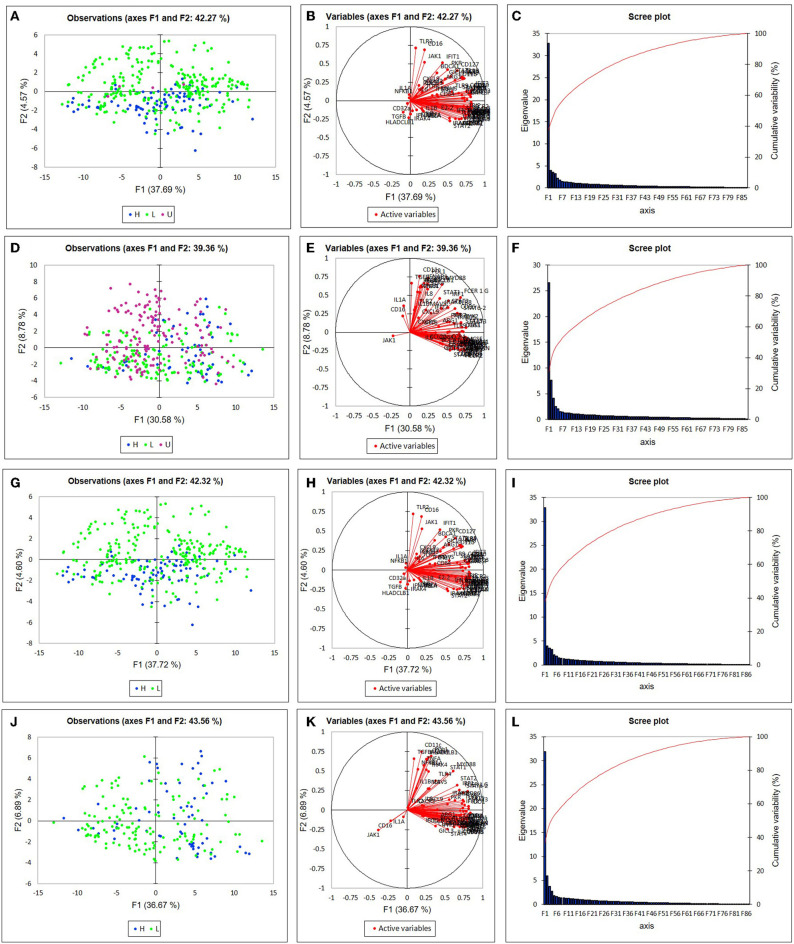
Principal component analysis (PCA) of single monocyte gene expression. Plots depict the first two differentiating factors among the gene expression data of non-classical monocytes (A,G), and classical monocytes (D,J). Blue (•) denotes data from subjects in the “T1IFN ND or > 1.3” group (n = 92 for CL, n = 63 for NC). Green (•) denotes data from subjects in the “IFNβ/α ≤ 1.3” group (n = 246 for CL, n = 142 for NC). Purple (•) denotes data from subjects in the “T1IFN undetected” group (n = 4 for CL, n = 154 for NC). In (G–L) T1IFN undetected cells were excluded from analysis. In (A,G), most of the monocytes from patients in the IFNβ/α > 1.3 group are on one side of the Y axis. In (D,J), most of the monocytes from patients in the IFNβ/α > 1.3 group are on one side of the X axis. Thus, the pretreatment T1IFN-β/α ratio appears to impact monocyte gene expression in subjects in the IFNβ/α > 1.3 group. Active variables (B,E,H,K) and scree plots (C,F,I,L) for monocyte PCA are shown.

