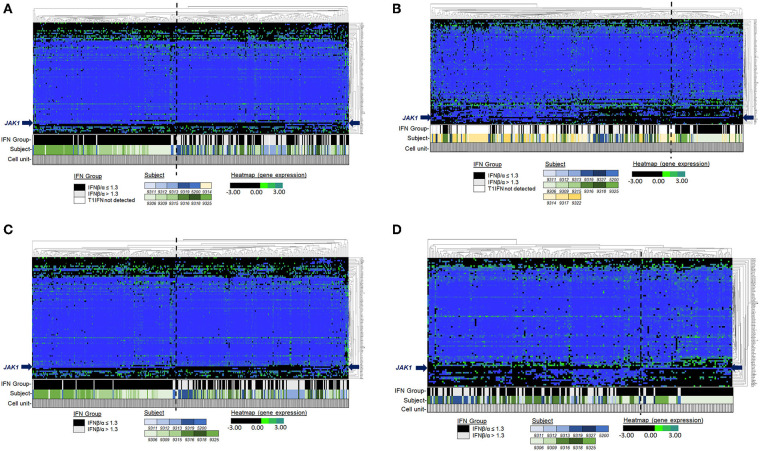
Figure 2.
Unsupervised hierarchical clustering of single cell pre-biologic gene expression in monoctyes. Genes (Y-axis). Single monocytes (X-axis). Both genes and cells were selected for clustering. The bars under the heatmap indicate the T1IFN group, subject, and width of data depicted that is from a single cell. Each subject is depicted by a different color: blue shading indicates the cell is from a subject in the IFNβ/α > 1.3 group; green shading indicates the cell is from a subject in the IFNβ/α ≤ 1.3 group; gold shading indicates the cell is from a subject in the T1IFN undetected group. In (A,B), T1IFN undetected cells were included in the analysis. In (C,D), cells from the T1IFN undetected group were excluded from analysis. See legends for relative expression level (black/green/blue) and T1IFN group (black/gray/white) color assignments.

